About the Fisher Yur4ik Indicator
The Fisher Yur4ik Indicator for MT4 is a momentum-based oscillator designed to highlight bullish and bearish shifts around a central zero level.
It fluctuates above and below the 0.00 line, allowing traders to quickly judge whether momentum favors buyers or sellers.
The indicator displays histogram bars that change color based on directional pressure.
Green bars signal bullish momentum when price strength returns above the zero level, while red bars signal bearish momentum when pressure moves back below it.
This Indicator is commonly used for scalping, day trading, and swing trading when aligned with the broader market trend.
It works best as a confirmation tool rather than a standalone signal generator, helping traders stay aligned with dominant momentum.
Free Download
Download the “fish-oscillator.mq4” MT4 indicator
Key Features
- Momentum oscillator centered around the 0.00 level.
- Color-coded histogram bars for bullish and bearish pressure.
- Helps filter entries in the direction of the main trend.
- Works well with trend and volatility indicators.
- Easy-to-read signals in a separate window.
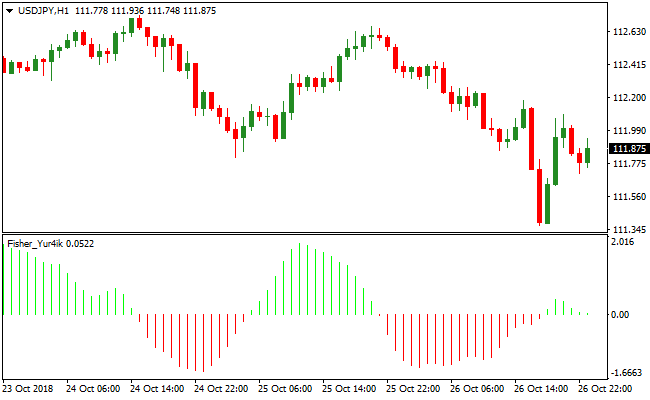
Indicator Chart
The image below shows the Fisher Yur4ik Indicator plotted below the main price chart.
Green and red histogram bars illustrate momentum shifts as price moves above or below the zero line, helping traders time entries within trending markets.

Guide to Trade with Fisher Yur4ik Indicator
Buy Rules
- Confirm the overall market trend is bullish.
- Wait for the histogram bars to turn green.
- Enter a buy trade when bars cross back above the 0.00 level.
- Ignore sell signals while bullish trend conditions remain active.
Sell Rules
- Confirm the overall market trend is bearish.
- Wait for the histogram bars to turn red.
- Enter a sell trade when bars cross back below the 0.00 level.
- Ignore buy signals while bearish trend conditions persist.
Stop Loss
- Place the stop loss below the recent swing low for buy trades.
- Place the stop loss above the recent swing high for sell trades.
- Widen stops slightly on higher timeframes.
- Exit early if momentum quickly flips against the trade.
Take Profit
- Close the full position when the histogram changes color.
- Exit if momentum fails to stay beyond the zero level.
- Use nearby support or resistance as an alternative target.
- Trail profits while momentum remains consistent.
Fisher Oscillator + HalfTrend Forex Scalping Strategy
This scalping strategy combines the Fisher Yur4ik Oscillator MT4 Forex Indicator with the HalfTrend 1.02 with Arrows Indicator MT4.
It is designed for fast and precise trades on M1, M5, and M15 time frames.
The Fisher oscillator shows momentum direction: green histogram bars signal a buy opportunity, and red bars signal a sell opportunity.
The HalfTrend indicator provides trend confirmation: a blue arrow indicates a buy trend while a magenta arrow indicates a sell trend.
By combining quick momentum detection with trend direction, traders gain a clear and efficient scalping setup suitable for high-liquidity periods.
Buy Entry Rules
- Wait for a green histogram bar on the Fisher Yur4ik oscillator.
- HalfTrend must show a blue arrow confirming a buy trend.
- Enter a buy when both signals are active and a bullish candle closes.
- Set the stop loss a few pips below the recent swing low.
- Take profit target: 10 to 25 pips or close when the Fisher histogram turns red, or HalfTrend prints a magenta arrow.
Sell Entry Rules
- Wait for a red histogram bar on the Fisher Yur4ik oscillator.
- HalfTrend must show a magenta arrow confirming a sell trend.
- Enter a sell when both signals align and a bearish candle closes.
- Set the stop loss a few pips above the recent swing high.
- Take profit target: 10 to 25 pips or exit when the Fisher histogram turns green, or HalfTrend prints a blue arrow.
Advantages
- The strategy aligns momentum and trend direction, which reduces random entries and improves accuracy on lower time frames.
- Both indicators react quickly to price changes, allowing traders to catch early intraday moves before they extend.
- Works very well on major pairs with tight spreads because the signal structure fits small pip targets.
- Adaptable for different risk profiles by adjusting stop distance and take profit size.
- Helps filter out most counter-trend moves since the HalfTrend arrow must match the Fisher momentum color.
Drawbacks
- Scalping requires continuous screen time and fast decision-making, which may not suit all traders.
- During ranging markets, the Fisher oscillator can flip colors frequently, leading to multiple false signals.
- HalfTrend arrows can sometimes appear late, which reduces the reward-to-risk ratio if the price has already moved.
Case Study 1
On EURUSD M5, the Fisher oscillator turned green at 1.0958 after a short pullback.
A few candles later, the HalfTrend indicator printed a blue arrow, confirming that the market had shifted back into an uptrend.
A buy entry was placed at 1.0960 once a bullish candle closed above the arrow.
The stop loss was set at 1.0948, just below the recent swing low to allow the trade some breathing room.
Price started climbing steadily and reached the 15 pip take profit level at 1.0975 within ten minutes.
Shortly after hitting the target, the Fisher histogram weakened and turned red, which confirmed a loss of momentum.
Case Study 2
On GBPUSD M15, a red Fisher histogram appeared at 1.2420 at the same time the market was failing to break higher.
A few minutes later, HalfTrend printed a magenta arrow, which confirmed that a bearish move was forming.
A sell trade was opened at 1.2417 once a strong bearish candle closed.
The stop loss was placed at 1.2435, above the recent swing high.
Momentum picked up quickly, and the price dropped with little hesitation.
The first target at 1.2397 for 20 pips was reached smoothly.
Since Fisher remained red and the trend was still intact, a small portion of the trade was left open and closed later at 1.2388 for an additional 9 pips.
Strategy Tips
- Trade only when both indicators agree to avoid counter-trend entries.
- Focus on pairs with tight spreads, such as EURUSD and GBPUSD, for cleaner scalping performance.
- Best results occur during high-volume sessions when price moves smoothly.
- Always keep stops outside the nearest swing level to prevent early stop-outs.
- Backtest on at least two months of data to understand how both indicators behave together.
Download Now
Download the “fish-oscillator.mq4” Metatrader 4 indicator
FAQ
What does the zero level represent?
The zero level acts as a momentum balance point.
Moves above it suggest increasing bullish pressure, while moves below it signal growing bearish strength.
Can this Indicator be used on lower timeframes?
Yes. Many traders apply it to lower charts for scalping, especially when volatility is high and spreads are tight.
Which tools pair well with Fisher Yur4ik?
It is often combined with Bollinger Bands, DMI, SMA, or EMA to confirm trend direction before acting on momentum shifts.
Summary
The Fisher Yur4ik Indicator delivers a straightforward way to track momentum changes around a neutral baseline.
Its color-coded histogram makes it easy to stay aligned with trend direction.
When combined with reliable trend filters, it performs strongly across scalping, intraday, and swing trading styles.
Further refinements often come from pairing it with volatility or structure-based tools.


