About the Forecasting Forex Indicator
The Forecasting Forex Indicator for MT4 is designed to provide traders with a glimpse of potential future price movements.
By analyzing historical data and market trends, it projects upcoming currency price direction, helping traders plan entries and exits ahead of time.
Displayed directly on the main MT4 chart as a purple forecasting line, the indicator shows the expected trend in the near future.
An upward slope signals potential bullish movement, while a downward slope suggests a likely bearish move.
This tool is ideal for intraday and swing traders who want to anticipate price swings.
It can also be combined with other technical indicators, such as support/resistance or moving averages, to improve signal accuracy and trade timing.
Free Download
Download the “forecasting-indicator.ex4” indicator for MT4
Key Features
- Forecasts future price movements with a custom algorithm
- The purple line clearly shows the projected market direction
- Helps traders plan entries and exits in advance
- Can be used on all currency pairs and timeframes
- Non-repainting design for reliable forward projections
- Works well with trend indicators or price action tools
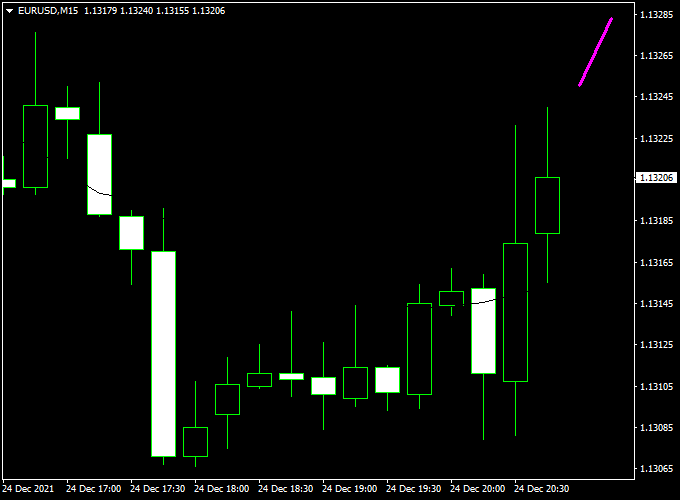
Indicator Chart
The chart shows a purple line forecasting future price movements.
When the line angles upward, traders can expect upward momentum, and when it angles downward, potential downward movement is indicated.
The visual projection helps traders anticipate market swings and align trades with the expected direction.

Guide to Trade with Forecasting Forex Indicator
Buy Rules
- Enter a buy trade when the purple line slopes upward.
- Confirm the trend with bullish candlestick patterns or short-term momentum indicators.
- Optional: enter on a small pullback for a better price.
Sell Rules
- Enter a sell trade when the purple line slopes downward.
- Confirm with bearish candlestick action or momentum signals.
- Optional: Avoid entries near strong support/resistance levels to prevent early exits.
Stop Loss Placement
- Buy trades: place just below the recent minor swing low or support level.
- Sell trades: place just above the recent minor swing high or resistance level.
- Alternatively, a small fixed pip stop or ATR-based stop can be applied.
Take Profit Targets
- Set profit near the next key support/resistance level or pivot zone.
- Trailing stops can be used to capture extended moves while locking in profits.
Practical Trading Tips
- Best used in trending markets where forecast projections follow the current momentum.
- Combine with additional indicators for confirmation to filter false projections.
- Adjust the line color and thickness for better visibility on different chart setups.
- Observe higher timeframe trends to improve trade context and accuracy.
MT4 Scalping Strategy: Forecasting Forex + Visual MACD
This strategy combines the Forecasting Forex Indicator with the Visual MACD Indicator to capture short-term momentum shifts and precise entry points.
The Forecasting Forex plots a purple line: upward-sloping for bullish forecasts and downward-sloping for bearish forecasts.
The Visual MACD displays a colored cloud: blue indicates bullish momentum and red indicates bearish momentum.
Trades are taken when both indicators align, ideal for 1-, 5-, or 15-minute intraday charts.
Buy Entry Rules
- The Forecasting Forex Indicator shows a purple upward-sloping line (bullish forecast).
- Visual MACD shows a blue cloud (bullish momentum).
- Enter a buy trade at the close of the confirming candle.
- Place a stop loss a few pips below the most recent swing low.
- Set take profit at the next intraday resistance level or a fixed pip target (15–25 pips).
Sell Entry Rules
- The Forecasting Forex Indicator shows a purple downward-sloping line (bearish forecast).
- Visual MACD shows a red cloud (bearish momentum).
- Enter a sell trade at the close of the confirming candle.
- Place a stop loss a few pips above the most recent swing high.
- Set take profit at the next intraday support level or a fixed pip target (15–25 pips).
Advantages
- Combines forecast direction with momentum confirmation for higher-probability trades.
- Easy to read visual signals with a purple line and a colored cloud.
- Works well on short intraday timeframes for scalping or quick trades.
- Flexible take profit using support/resistance or pip targets, depending on market volatility.
Drawbacks
- Requires both indicators to align for entry, which may limit trade frequency.
- Not suitable for long-term trades.
- May need quick execution during fast-moving markets.
Case Study 1: EUR/USD on 5-Minute Chart
During the London open, the Forecasting Forex Indicator displayed a purple upward-sloping line while the Visual MACD showed a blue cloud.
A buy trade was initiated at 1.0720.
The recent swing low was 1.0708, and the stop loss was placed at 1.0705 (15 pips risk).
The next resistance zone was at 1.0742, which became the take profit target for 22 pips.
Price advanced strongly and hit the target, resulting in 22 pips profit.
Case Study 2: AUD/JPY on 15-Minute Chart
During the New York session, the Forecasting Forex Indicator printed a purple downward-sloping line while the Visual MACD showed a red cloud.
A sell trade was entered at 96.85.
The recent swing high stood at 96.98, and the stop loss was placed at 97.00 (15 pips risk).
The next support level was around 96.60, which became the take profit target for 25 pips.
Price declined steadily and reached the target, giving 25 pips profit.
Strategy Tips
- Trade major pairs during high-liquidity sessions for stronger moves and tighter spreads.
- Wait for both the Forecasting line and the MACD cloud to align before entering trades.
- Use support/resistance or pip targets for take profit rather than fixed risk-to-reward ratios.
- Consider trailing stops when trades move favorably to lock in profits.
Download Now
Download the “forecasting-indicator.ex4” indicator for Metatrader 4
FAQ
How does the indicator forecast future prices?
The purple line uses a proprietary calculation that analyzes historical price data and trend patterns to project near-future price movement.
Does it repaint after generating a forecast?
No. Once the forecast line is plotted, it remains fixed, allowing traders to act confidently on the projected trend.
Can I combine it with other indicators?
Yes. For better accuracy, it works well alongside trend-following indicators, moving averages, or support/resistance levels.
What timeframes are recommended?
It can be used on any timeframe, but M15, M30, and H1 are ideal for short-term trades, while H4 or daily charts can help with swing trades.
Summary
The Forecasting Forex Indicator for MT4 provides a forward-looking view of currency price movements using a clear purple forecasting line.
It helps traders anticipate bullish or bearish swings, making it a useful tool for planning entries and exits in advance.
Combined with additional trend or confirmation indicators, it can enhance trade accuracy and timing.
Its non-repainting design and intuitive visual signals make it a practical choice for both new and experienced Forex traders aiming to capture short-term market opportunities.


