About the Forecasting of Price Range Indicator
The Forecasting of Price Range Indicator for MT4 is a powerful tool that estimates the expected trading range of a currency pair for the day.
Analyzing recent price action and volatility gives traders a clear idea of where prices are likely to move, helping them plan entries, exits, and risk levels effectively.
Displayed on the main MT4 chart as a red bar, the indicator also signals the expected trend direction.
If the bar is positioned above the opening price, a bullish day is anticipated. If it is below, the market is expected to move lower.
This indicator is ideal for intraday traders who want a daily projection of price movement.
It can be combined with trend indicators or support/resistance levels to refine trading decisions.
Free Download
Download the “forecasting-of-price-range.mq4” indicator for MT4
Key Features
- Forecasts the expected daily trading range for currency pairs
- The red bar visually shows projected price movement
- Indicates expected bullish or bearish trend for the day
- Helps in setting realistic stop loss and take profit levels
- Non-repainting for reliable daily projections
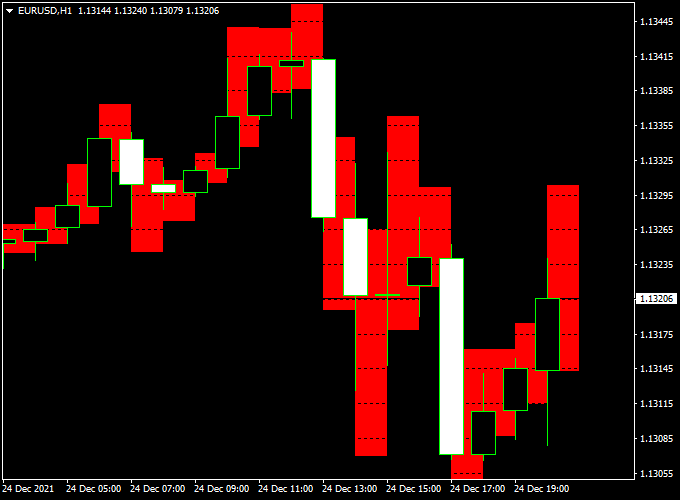
Indicator Chart
The chart displays a red bar showing the predicted trading range.
When the bar is above the open price, it suggests a bullish bias, while a bar below the open price signals a bearish bias.
Traders can use this information to plan intraday trades and set appropriate risk management levels.

Guide to Trade with Forecasting of Price Range Indicator
Buy Rules
- Open a buy trade if the red bar is positioned above the open price.
- Confirm with intraday bullish candlestick patterns or short-term momentum indicators.
Sell Rules
- Open a sell trade if the red bar is positioned below the open price.
- Confirm with bearish candlestick formations or short-term oscillators.
Stop Loss Placement
- Buy trades: place slightly below the daily open or recent minor support.
- Sell trades: place slightly above the daily open or recent minor resistance.
Take Profit Targets
- Set TP near the predicted upper or lower bound of the red bar range.
- Partial exits can be taken mid-range if the market shows early signs of reversal.
- Trailing stops can help capture extended daily movements while protecting profits.
Practical Trading Tips
- Use the indicator at the start of the trading day to plan trades in advance.
- Combine with support/resistance levels to confirm exit targets.
- Use additional oscillators or trend filters for more reliable entries.
MT4 Swing Trading Strategy: Forecasting of Price Range + VAR Moving Average
This swing trading strategy combines the Forecasting of Price Range Indicator with the VAR Moving Average Indicator to capture medium-term price swings on the H1 timeframe.
The Forecasting of Price Range indicator predicts the likely daily direction: big red candles indicate a bullish day, while big white candles indicate a bearish day.
The VAR Moving Average confirms trend direction: a green dotted line signals bullish momentum, and a red dotted line signals bearish momentum.
Using both indicators together helps traders enter swing trades aligned with the predicted market direction for higher-probability setups.
Buy Entry Rules
- Forecasting of Price Range shows a big red candle indicating a bullish expected day.
- The VAR Moving Average green dotted line is above the price, confirming bullish momentum.
- Enter a buy trade at the close of the confirming H1 candle.
- Place a stop loss below the recent swing low or the nearest support level.
- Set take profit at the next resistance level or a fixed target based on historical swing ranges (e.g., 50–80 pips).
Sell Entry Rules
- Forecasting of Price Range shows a big white candle, indicating a bearish expected day.
- The VAR Moving Average red dotted line is below the price, confirming bearish momentum.
- Enter a sell trade at the close of the confirming H1 candle.
- Place a stop loss above the recent swing high or nearest resistance level.
- Set take profit at the next support level or a fixed target based on historical swing ranges (e.g., 50–80 pips).
Advantages
- Combines forecasted daily direction with moving average trend confirmation for higher-probability swings.
- Effective for medium-term trades on H1 charts.
- Visual signals (candles + dotted lines) make entry decisions clear and fast.
- Flexible take profit allows adaptation to market volatility and swing range.
Drawbacks
- May provide false signals during sideways or low-volatility markets.
- Requires patience as H1 swings take time to develop.
- Not suitable for scalping or very short-term trades.
- Stop losses need careful placement to avoid being triggered by intraday noise.
Case Study 1: EUR/GBP on H1 Chart
During a bullish predicted day, the Forecasting of Price Range indicator displayed large red candles, and the VAR Moving Average showed a green dotted line above the price.
A buy trade was entered at 0.8730.
The recent swing low was 0.8718, placing the stop loss at 0.8715 (15 pips risk).
The next resistance level was at 0.8790, which was used as the take profit target.
Price steadily climbed and reached the target, resulting in a gain of 60 pips.
Case Study 2: AUD/CAD on H1 Chart
During a bearish predicted day, the Forecasting of Price Range displayed large white candles, and the VAR Moving Average red dotted line was below the price.
A sell trade was entered at 0.9125.
The recent swing high was 0.9140, placing the stop loss at 0.9145 (20 pips risk).
The next support level was at 0.9065, which became the take profit target.
Price moved downward over several hours and hit the target, providing a 60-pip profit.
Strategy Tips
- Focus on high-liquidity pairs to reduce spreads and improve swing execution.
- Confirm signals on the H1 chart before entering trades.
- Monitor nearby support/resistance levels to adjust take profit and stop loss dynamically.
- Avoid entering trades before major economic news releases that may cause unpredictable swings.
- Consider trailing stops once the price moves favorably to lock in profits on longer H1 swings.
Download Now
Download the “forecasting-of-price-range.mq4” indicator for Metatrader 4
FAQ
How is the daily price range forecast calculated?
The indicator analyzes recent price volatility and intraday trends to estimate the high and low range for the trading day.
Can it indicate the trend direction as well?
Yes. The position of the red bar relative to the open price shows the expected bias—above indicates bullish, below indicates bearish.
Does it repaint during the day?
No. Once plotted, the red bar remains fixed, giving traders a reliable daily forecast.
How can I use it to manage risk?
By showing the projected high and low, traders can place stop loss and take profit orders more effectively, adjusting for daily volatility.
Summary
The Forecasting of Price Range Indicator for MT4 offers traders a clear projection of the daily trading range and trend direction.
Its red bar provides a simple visual guide for bullish or bearish bias, helping traders plan entries, exits, and risk management strategies.
By combining this tool with additional trend analysis or support/resistance levels, traders can enhance the reliability of trades.


