About the Forex Chart Patterns Indicator
The Forex Chart Patterns indicator for Metatrader 4 is built for traders who rely on classic price action formations.
It automatically scans the chart and highlights well-known chart patterns without manual drawing.
This saves time and removes subjectivity from pattern recognition.
The indicator detects popular formations such as head and shoulders, double tops, triangles, and wedge patterns.
Each pattern is plotted directly on the price chart as it develops.
This allows traders to react faster to emerging setups instead of spotting them too late.
Because it is based on pure price action, the indicator works across all market conditions.
Traders often use it as a decision-support tool rather than a standalone system.
Free Download
Download the “Price patterns.ex4” indicator for MT4
Key Features
- Automatically identifies classic chart patterns on MT4.
- Detects reversal and continuation formations.
- Based entirely on price action analysis.
- Works on all currency pairs and time frames.
- Eliminates manual pattern drawing.
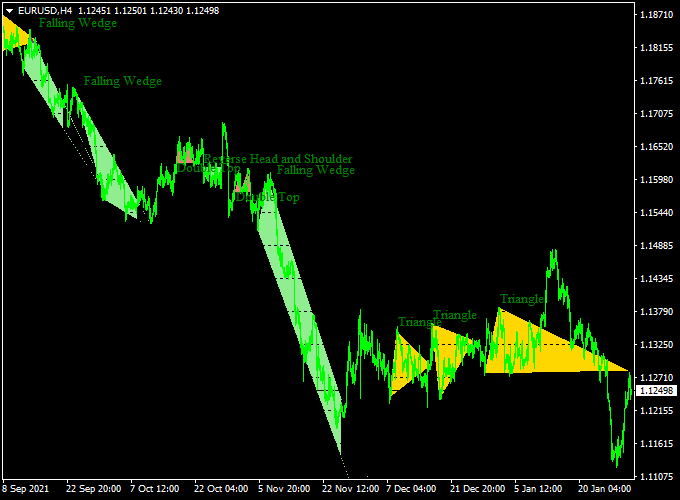
Indicator Chart
The Forex Chart Patterns indicator chart shows highlighted formations drawn directly over the price.
Patterns such as triangles, wedges, and head and shoulders are marked as they form.
This helps traders visually confirm potential breakout or reversal zones.
It allows traders to focus on execution rather than pattern hunting.

Guide to Trade with Forex Chart Patterns Indicator
Buy Rules
- Identify a bullish pattern such as a double bottom or reverse head and shoulders.
- Wait for the price to approach the breakout or confirmation area.
- Enter a buy trade after bullish price confirmation.
Sell Rules
- Identify a bearish pattern such as a double top or head and shoulders.
- Wait for the price to react near the pattern completion zone.
- Enter a sell trade after bearish price confirmation.
Stop Loss
- Place the stop loss beyond the invalidation point of the pattern.
- For bullish patterns, set it below the recent structure low.
- For bearish patterns, set it above the recent structure high.
Take Profit
- Target the projected move based on pattern height.
- Scale out partial profits at nearby support or resistance.
- Adjust targets based on market volatility.
Chart Pattern + SuperTrend NRP Forex Strategy
This strategy blends two powerful tools for precision trading.
The Forex Chart Patterns Indicator automatically detects key formations such as head and shoulders, double tops, triangles, and wedges—helping traders spot potential reversals early.
The SuperTrend NRP Indicator confirms the dominant trend direction by showing a green line during uptrends and an orange line during downtrends.
Together, they form a reliable setup for identifying high-probability entries in the direction of the market trend.
The idea is to take pattern breakout setups only when they align with the trend direction signaled by SuperTrend NRP.
This works well on timeframes like M30 and H1.
It’s suited to traders who prefer structured setups based on chart geometry plus trend confirmation.
You’ll look for patterns forming, then wait for the breakout in the direction of the SuperTrend line.
Buy Entry Rules
- Identify a bullish chart pattern via the Chart Patterns Indicator: e.g., inverse head & shoulders, double bottom, rising wedge breakout, triangle breakout upward.
- Confirm that the SuperTrend NRP line is green (indicating uptrend).
- Enter long when price breaks above the pattern’s resistance (neckline or upper trend line) with a valid candle close beyond it.
- Set stop loss below the pattern’s swing low or the lower boundary of the pattern (whichever is tighter).
- Set take profit based on pattern height (e.g., measure distance between pattern extremes and project upward) or aim for a risk-reward ratio of 1:2 or more.
Sell Entry Rules
- Identify a bearish chart pattern: head & shoulders, double top, falling wedge breakout downward, triangle breakdown, etc.
- Confirm that the SuperTrend NRP line is orange (indicating a downtrend).
- Enter short when the price breaks below the pattern’s support (neckline or lower boundary) with a confirmed close below.
- Set stop loss above the pattern’s swing high or the pattern’s upper boundary.
- Set take profit via pattern height projection downward or aim for a risk-reward of 1:2 or more.
Advantages
- Pattern breakouts can offer clear structure and logical target points.
- Trend confirmation from SuperTrend NRP helps filter false pattern signals.
- Works across multiple currencies and timeframes (with pattern scale adjustments).
- Allows symmetry in entries and exits (pattern measurement techniques).
- Gives you both geometry and trend alignment, improving confidence in trades.
Drawbacks
- Patterns may fail or turn into false breakouts, especially in volatile or choppy conditions.
- The trend line may lag, so sometimes the SuperTrend line might flip late, causing missed signals or late entries.
- Some small or imperfect patterns may be misrecognized or produce weak breakouts.
- Slippage, spread, or delays in execution can hurt projected returns, especially in fast moves.
- In consolidating markets, pattern signals may trigger often, but hit stop losses more frequently.
Example Case Study 1
On EUR/USD (H1), a double bottom formed between 1.1000 and 1.0950.
The Chart Patterns Indicator flagged this pattern.
Meanwhile, the SuperTrend NRP line was green, indicating an uptrend.
Price broke above the neckline at 1.1020 in a strong bullish candle.
A long was entered at 1.1025, stop loss placed at 1.0975 (below the pattern low), and target projected to 1.1125 (pattern height ~100 pips).
The pair rose to 1.1120 over several hours and nearly reached the target, giving a 95 pip gain.
Example Case Case Study 2
On USD/JPY (M30), a rising wedge pattern formed, and the Chart Patterns Indicator flagged it.
The SuperTrend NRP line was orange, pointing to a downtrend.
When the price broke below the lower wedge line around 140.50, a short entry was taken at 140.45.
Stop loss was placed above the wedge high at 141.05, and the target was projected downward by the wedge height, aiming near 139.45.
The price fell over the next session and hit around 139.60, giving an 85 pip profit.
Strategy Tips
- Take patterns only in the direction of the SuperTrend NRP line: green for buys, orange for sells.
- Wait for a candle close beyond the pattern boundary before entering to reduce fake breakouts.
- Prefer larger and cleaner patterns over tiny or compressed ones for more reliable moves.
- Test the strategy on different pairs (EUR/GBP, GBP/USD, USD/CAD, etc.) to see which patterns and trend alignments perform best.
Download Now
Download the “Price patterns.ex4” indicator for Metatrader 4
FAQ
Which patterns does the indicator detect automatically?
It identifies head and shoulders, double and triple tops and bottoms, triangles, and wedge patterns.
These are among the most widely traded chart formations.
Does the indicator detect patterns in real time?
Yes, patterns are displayed as price action evolves.
This helps traders prepare for potential breakouts or reversals early.
Can the indicator be used for confirmation only?
Yes, many traders use it to confirm their own market analysis.
It works well alongside trend or momentum indicators.
Is the indicator suitable for beginners?
It helps beginners learn pattern recognition faster.
Visual pattern marking reduces the learning curve significantly.
Summary
The Forex Chart Patterns indicator for MT4 simplifies one of the most important aspects of technical analysis.
By automatically detecting key price formations, it removes guesswork from chart pattern trading.
This allows traders to focus on timing, risk control, and execution.
Its price action foundation makes it adaptable to different trading styles.
Scalpers, swing traders, and position traders can all benefit from its insights.
The indicator supports disciplined decision-making rather than emotional trading.
While chart patterns are not perfect predictors, this tool provides a strong analytical edge.
When combined with proper confirmation and risk management, it can greatly enhance consistency.
It is a practical addition to any trader focused on price behavior and market structure.


