About the Forex Market Profile Indicator
The Forex Market Profile indicator is a free MT4 tool designed to help traders understand how price behaves over time.
Instead of focusing only on indicators that follow price, this tool highlights where the market has spent the most time trading.
These areas often act as important decision zones where price reacts, pauses, or changes direction.
The indicator plots an array of blue horizontal lines directly on the main MT4 chart window.
These lines represent market profile levels that can be used for trade entries, exits, or as a trend filter.
Traders can use these levels to identify value areas, potential breakout zones, and regions where price may stall or reverse.
This makes the Forex Market Profile indicator suitable for both intraday trading and higher time frame analysis.
Free Download
Download the “market profile.mq4” indicator for MT4
Key Features
- Displays market profile levels directly on the MT4 chart.
- Helps identify areas of high trading activity.
- Can be used for entries, exits, or trend filtering.
- Supports both short-term and longer-term trading styles.
- Useful for combining with price action strategies.
Indicator Chart
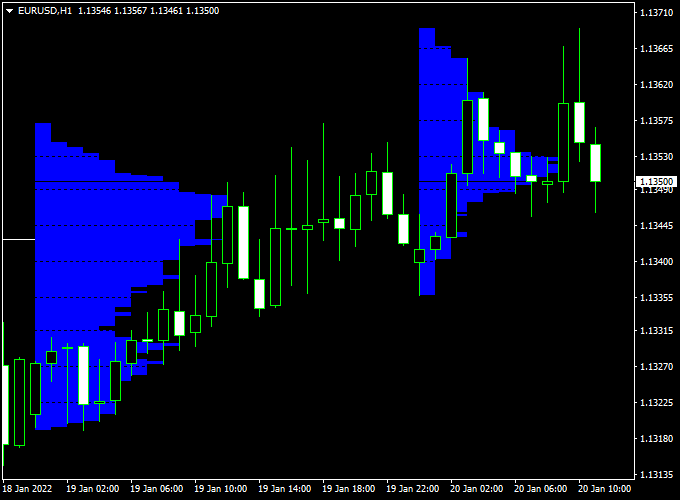
The Forex Market Profile indicator chart displays blue horizontal lines across the price chart.
These lines highlight key market profile levels where price has previously traded heavily.
Traders use these zones to identify potential buying and selling interest, trend continuation areas, or possible reversals.

Guide to Trade with the Forex Market Profile Indicator
Buy Rules
- Look for the price approaching a lower market profile level.
- Confirm bullish price behavior near the level.
- Enter a buy trade once price starts moving away from the profile zone.
Sell Rules
- Watch price approaching an upper market profile level.
- Confirm bearish price behavior near the level.
- Enter a sell trade once price moves away from the profile zone.
Stop Loss
- Place the stop loss beyond the next market profile level.
- For buy trades, place the stop below the profile zone.
- For sell trades, place the stop above the profile zone.
Take Profit
- Set take profit near the next opposing market profile level.
- Scale out partial profits when price reacts at intermediate levels.
- Allow strong moves to run when price breaks through profile zones.
Practical Tips
- Use higher time frames to define dominant market areas.
- Combine with candlestick patterns for better timing.
- Market profile works best in active trading sessions.
Market Profile and Trend Predictor V1.0 Forex MT4 Strategy
The MT4 Market Profile and Trend Predictor V1.0 Forex Strategy combines professional market volume distribution analysis with a precise signal-based entry system.
This hybrid setup helps traders identify key price levels where institutional activity is concentrated and time their entries using clear visual arrows.
It works effectively on M15, H1, and H4 timeframes, offering a solid balance between accuracy and trading frequency.
The Forex Market Profile Indicator shows the price levels where the majority of trading volume has occurred.
These levels represent strong support and resistance areas where institutional traders typically make their moves.
The Trend Predictor V1.0 Indicator provides simple, non-repainting buy and sell arrows — blue for bullish entries and red for bearish ones — helping traders act decisively when the market confirms a directional move.
By combining these two tools, traders can identify high-probability trading opportunities: the Market Profile defines the “where,” and the Trend Predictor defines the “when.”
The strategy aims to enter trades near volume nodes and ride momentum away from them for optimal risk/reward potential.
Buy Entry Rules
- Wait until the price is trading near a Market Profile low-volume area or a visible support zone on the profile.
- Confirm that a blue upward arrow appears from the Trend Predictor V1.0 Indicator.
- Ensure the arrow forms above or close to a value area low (VAL) on the Market Profile.
- Enter a buy trade once the candle closes with the blue arrow confirmed.
- Place a stop loss a few pips below the nearest Market Profile support or below the recent swing low.
- Take profit near the value area high (VAH) or when a red arrow appears.
Sell Entry Rules
- Wait for the price to approach a Market Profile resistance or high-volume node area.
- Confirm that a red downward arrow appears from the Trend Predictor V1.0 Indicator.
- Ensure the arrow forms below or near the value area high (VAH).
- Enter a sell position at candle close with the red arrow confirmed.
- Set a stop loss a few pips above the Market Profile resistance or above the last swing high.
- Take profit around the value area low (VAL) or once a blue arrow appears.
Advantages
- Combines volume-based analysis with direct entry signals for clarity.
- Helps identify institutional activity zones before taking trades.
- Reduces guesswork by aligning market structure with signal timing.
- Suitable for both intraday and swing trading styles.
- Works across major currency pairs and gold.
Drawbacks
- Performance depends on correct Market Profile interpretation.
- False arrows can appear during low-volume sessions or consolidations.
- Requires patience to wait for alignment between profile levels and signal arrows.
- Not ideal for ultra-short scalping due to the volume data lag.
Case Study 1: EUR/USD M30
During the London session, the Market Profile showed a strong value area low around 1.0725.
Price approached this zone with declining volume.
A blue arrow from the Trend Predictor V1.0 appeared at 1.0730, confirming a bullish reversal.
A buy trade was placed with a stop loss at 1.0715 and a target at the value area high of 1.0780.
The move reached the target within four hours, resulting in +50 pips profit as volume expanded upward through the profile’s mid-zone.
Case Study 2: GBP/JPY H1
In the New York session, the Market Profile identified a resistance cluster near 192.40.
As the price tested this level, a red arrow appeared from the Trend Predictor V1.0 at 192.35.
A sell trade was taken with a stop loss above 192.60 and a target at 191.70, near the lower value area.
The price dropped sharply, hitting the target for a +65 pip gain before a blue arrow appeared, signaling the end of the move.
Strategy Tips
- Trade mainly during the London and New York sessions for better volume accuracy.
- Focus on areas near the value area high and low for reversals, and mid-value for continuations.
- Confirm Trend Predictor signals with candlestick patterns (pin bars or engulfing candles).
- Use trailing stops once the price moves beyond the Market Profile mid-zone.
- Avoid entering trades when arrows appear within tight consolidations or flat profiles.
- Combine with higher timeframe Market Profile data for directional bias.
Download Now
Download the “market profile.mq4” indicator for Metatrader 4
FAQ
What makes market profile different from regular indicators?
Market profile focuses on where price spends time rather than how fast it moves. This helps identify important price zones instead of chasing momentum.
Can this indicator be used as a standalone system?
It can be used on its own, but many traders combine it with price action or trend indicators for confirmation.
Which time frame works best with the market profile indicator?
Higher time frames often provide stronger levels, while lower time frames are useful for precise entries around those zones.
Summary
The Forex Market Profile MT4 indicator offers a different way to analyze the market by focusing on price acceptance rather than price speed.
By plotting market profile levels directly on the chart, traders can identify areas where price is likely to react, consolidate, or reverse.
This indicator is flexible and works across all currency pairs and time frames.
It can be used for trade entries, exits, or as a trend filter within a broader trading strategy.
With proper risk management and confirmation, the Forex Market Profile indicator helps traders make more informed decisions and better understand market behavior.


