
About the Forex Trend Candlestick Painter Indicator
The Forex Trend Candlestick Painter Indicator for MT4 is a trend-following tool that transforms standard price candles into color-coded trend candles.
Its main purpose is to help traders stay aligned with the dominant market direction without relying on complex calculations or multiple indicators.
By changing candle colors based on trend conditions, it simplifies decision-making and reduces hesitation during live trading.
The indicator appears directly in the main MT4 chart window as green and red candlesticks.
Green candles represent bullish market conditions, while red candles indicate bearish pressure.
This visual approach allows traders to read trend direction instantly and focus on execution rather than constant analysis.
You can use it as a standalone trend guide or combine it with other tools such as support and resistance or momentum indicators.
Free Download
Download the “painter indicator.mq4” indicator for MT4
Key Features
- Colors candlesticks based on the prevailing market trend.
- Displays directly on the main MT4 price chart.
- Helps traders stay aligned with bullish or bearish direction.
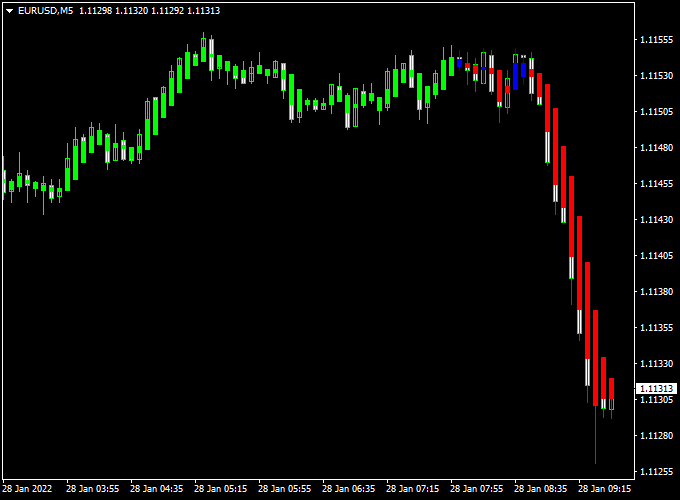
Indicator Chart
The Forex Trend Candlestick Painter Indicator chart replaces standard candles with green and red trend candles.
Green candles signal bullish momentum, while red candles highlight bearish conditions.
This makes trend shifts easier to spot and helps traders avoid trading against the dominant direction.
The chart presentation supports fast decision-making during active market sessions.
Guide to Trade with Forex Trend Candlestick Painter Indicator
Buy Rules
- Open a buy trade when the first green candlestick appears.
- Confirm that consecutive green candles continue to print.
Sell Rules
- Open a sell trade when the first red candlestick appears.
- Look for follow-through with additional red candles.
Stop Loss
- Place the stop beyond the most recent swing level.
- Exit the trade if the candle color switches against the position.
- Adjust stop distance based on current market volatility.
Take Profit
- Target nearby support or resistance zones.
- Use a fixed pip target of your preference.
- Hold the position while the candle color remains unchanged.
Trend Painter XP Moving Average MT4 Intraday Strategy
The Trend Painter XP Moving Average MT4 Intraday Strategy is a clean and effective trading approach that combines visual candlestick signals with dynamic trend confirmation.
It uses the Forex Trend Candlestick Painter Indicator and the XP Moving Average Indicator to identify precise entry and exit points during active market hours.
This strategy is built for intraday traders who prefer a simple visual system without clutter.
It works best on the M15 and M30 time frames, capturing trends as they form and using color-based confirmation to avoid hesitation.
The key idea is to trade in the direction of the XP Moving Average trend while using the Trend Candlestick Painter for signal timing.
When both indicators agree, trades tend to develop with higher momentum and smoother profit runs.
Why This Strategy Works
The Forex Trend Candlestick Painter shows market momentum directly on the chart through colored candles—green for bullish moves and red for bearish ones.
This allows traders to read the market at a glance.
Meanwhile, the XP Moving Average filters out false moves by showing whether the overall trend is up (green line) or down (red line).
Combining these two gives traders a reliable visual confirmation system that’s easy to follow throughout the trading day.
Buy Entry Rules
- Wait until the XP Moving Average line turns green, indicating an uptrend.
- Open a buy position when the first green candle appears on the chart.
- Set the stop loss below the most recent swing low or at least 25 pips.
- Take profit when the first red candle appears or target 40–60 pips for intraday trades.
- If a red candle appears while the XP Moving Average remains green, wait for confirmation before closing.
Sell Entry Rules
- Wait until the XP Moving Average line turns red, indicating a downtrend.
- Open a sell position when the first red candle appears on the chart.
- Set the stop loss above the last swing high or 25 pips, whichever is greater.
- Take profit when the first green candle appears or aim for 40–60 pips.
- Reverse the open position if an opposite signal candle appears during the same trend session.
Advantages
- Easy visual confirmation for both entry and trend direction.
- Ideal for beginners and experienced intraday traders.
- Adaptable to all major forex pairs.
- Helps capture continuous trend movements with minimal lag.
Drawbacks
- Performance can vary in low volatility periods.
Case Study 1 – EUR/USD (M15 Time Frame)
During the London session, the XP Moving Average turned green, confirming an uptrend.
On the 15-minute chart, the first green candle from the Trend Candlestick Painter appeared at 1.0850.
A buy trade was placed with a 25-pip stop loss and a 50-pip take profit.
Over the next two hours, EUR/USD rallied strongly to 1.0900, achieving the target for a clean +50 pip gain.
The alignment between the XP trend color and the painted candle provided an early and accurate entry into the move.
Case Study 2 – USD/JPY (M30 Time Frame)
In the early New York session, the XP Moving Average turned red, signaling a shift into a downtrend.
The first red candle appeared at 151.70 on the 30-minute chart.
A sell position was opened with a stop loss of 30 pips and a take profit of 60 pips.
As the U.S. market volume increased, USD/JPY dropped steadily to 151.10, hitting the target for +60 pips.
The clear trend confirmation prevented premature entries and kept the trader aligned with the market’s direction.
Strategy Tips
- Trade during the most active sessions (London and New York) for stronger momentum.
- Avoid trading when the XP Moving Average switches colors frequently—this indicates sideways markets.
- Combine with a higher time frame confirmation (H1) to ensure trend strength.
- Adjust stop loss and target size depending on pair volatility.
- Consider partial profit-taking at 30 pips to secure gains in volatile sessions.
Download Now
Download the “painter indicator.mq4” indicator for Metatrader 4
FAQ
What does the candle color represent?
Green candles reflect bullish trend conditions.
Red candles indicate bearish trend pressure.
Is this indicator suitable for beginners?
Yes, the color-based approach is easy to interpret.
It helps new traders focus on trend direction without overcomplication.
Can the indicator be used on lower time frames?
It performs well on lower time frames for scalping and intraday trading.
Higher time frames can be used for broader trend analysis.
Should this indicator be used alone?
It can be traded on its own.
Combining it with key price levels can further improve timing.
Summary
The Forex Trend Candlestick Painter Indicator for MT4 offers a straightforward way to follow market direction using colored price candles.
Removing unnecessary complexity helps traders remain focused on trend-based opportunities.
Its direct chart integration supports faster reactions during live market conditions.
The indicator is flexible, easy to apply, and suitable for various trading styles.
When paired with disciplined trade management, it can become a reliable component of a consistent MT4 trading approach.
For traders who prefer visual trend confirmation, this indicator delivers practical value.


