About the Forex Vector Indicator
Forex Vector for MT4 is a non-repainting trend indicator designed to provide accurate buy and sell signals for traders of all skill levels.
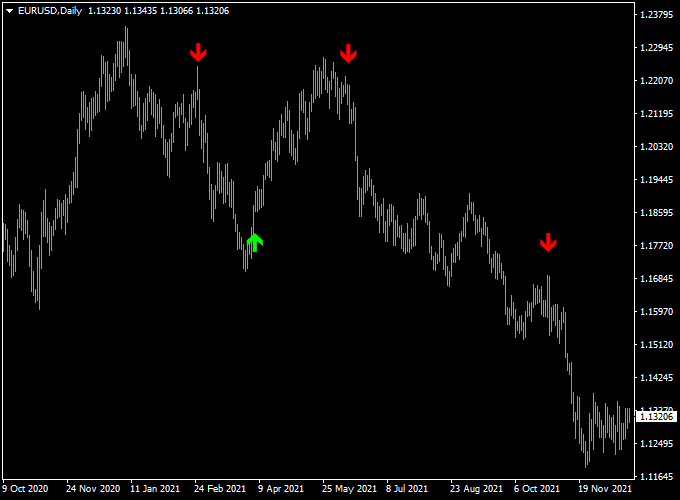
Its green and red arrows appear directly on the chart, indicating optimal entry points for trading opportunities.
This indicator works on any timeframe and is especially effective for scalping and intraday trading on lower timeframes.
Its straightforward signals make it ideal for beginners, while experienced traders can use it to improve trade timing and capture consistent moves in the market.
The simplicity of Forex Vector allows traders to focus on execution without complex settings, and it can also be combined with other trend or momentum tools for additional confirmation.
Free Download
Download the “FOREX VECTOR.ex4” indicator for MT4
Key Features
- Non-repainting green and red arrows indicate buy and sell signals
- Simple, easy-to-read chart interface
- Effective on any timeframe for scalping or day trading
- Ideal for beginners, yet useful for experienced traders
- Works on all currency pairs
- Can be paired with other indicators for trend confirmation
Indicator Chart
The chart displays green arrows for potential buy entries and red arrows for sell entries.
Each arrow is plotted at an optimal moment based on the indicator’s trend algorithm, helping traders enter trades with higher probability.
The signals are fixed and do not repaint, giving confidence for real-time trading.

Guide to Trade with the Forex Vector Indicator
Buy Rules
- Open a buy trade when a green arrow appears on the chart.
- Optional: confirm with a short-term bullish candle or moving average alignment.
Sell Rules
- Open a sell trade when a red arrow appears on the chart.
- Optional: confirm with a bearish candlestick or momentum indicator.
Stop Loss Placement
- Buy trades: place just below the nearest swing low or minor support.
- Sell trades: place just above the nearest swing high or minor resistance.
Take Profit Targets
- Set profit targets near the next support/resistance level.
- Consider partial exits if the market shows early signs of reversal.
- Trailing stops can be applied to capture extended moves while protecting profits.
Practical Trading Tips
- Best used during trending market conditions for higher accuracy.
- Combine with other trend-following or momentum indicators for confirmation.
- Follow a consistent risk management plan to preserve capital.
MT4 Scalping Strategy: Forex Vector + Tunnel MA
This strategy combines the Forex Vector Indicator with the Tunnel MA Indicator to provide high-probability intraday trading signals.
The Forex Vector Indicator gives clear arrows on the chart: green arrows indicate bullish setups and red arrows indicate bearish setups.
The Tunnel MA Indicator adds trend confirmation: when candlesticks are above the Tunnel MA, the market is bullish; when candlesticks are below, the market is bearish.
Using both indicators together allows traders to filter out weak signals and scalp fast-moving pairs on 1-minute, 5-minute, or 15-minute charts.
Buy Entry Rules
- A green arrow appears on the Forex Vector Indicator chart.
- The candlestick is above the Tunnel MA line, confirming a bullish trend.
- Enter a buy trade at the close of the confirming candle.
- Place a stop loss a few pips below the recent swing low or below the Tunnel MA.
- Set take profit at the next minor resistance level or use a fixed pip target (e.g., 12–20 pips for scalping).
Sell Entry Rules
- A red arrow appears on the Forex Vector Indicator chart.
- The candlestick is below the Tunnel MA line, confirming a bearish trend.
- Enter a sell trade at the close of the confirming candle.
- Place a stop loss a few pips above the recent swing high or above the Tunnel MA.
- Set take profit at the next minor support level or a fixed pip target (e.g., 12–20 pips for scalping).
Advantages
- Combines precise arrow signals with trend confirmation for higher probability trades.
- Effective for fast intraday scalping on lower timeframes.
- Flexible take profit options allow adaptation to market volatility.
Drawbacks
- Requires both arrow and Tunnel MA alignment, which may reduce trade frequency.
- Less suitable for long-term trading or swing trades.
- Quick execution is needed on small timeframes to capture scalps.
Case Study 1: EUR/CHF on 5-Minute Chart
During the London session, a green arrow appeared on the Forex Vector chart while the candlesticks remained above the Tunnel MA, confirming a bullish trend.
A buy trade was entered at 1.0815.
The recent swing low was 1.0805.
The stop loss was set at 1.0802 (13 pips risk).
The next minor resistance was at 1.0830, which became the take profit target.
Price moved upward and hit the target, providing 15 pips profit.
Case Study 2: GBP/AUD on 1-Minute Chart
During the New York session, a red arrow appeared on the Forex Vector chart while candlesticks remained below the Tunnel MA, confirming a bearish trend.
A sell trade was entered at 1.8050.
The recent swing high was 1.8060, and the stop loss was placed at 1.8063 (13 pips risk).
The next minor support level was at 1.8035, which became the take profit target.
Price moved down quickly and reached the target, resulting in 15 pips profit.
Strategy Tips
- Use this strategy on high-liquidity pairs to minimize spreads and slippage.
- Ensure both the arrow signal and Tunnel MA trend alignment before entering trades.
- Adjust take profit according to nearby support/resistance levels or fixed pip targets for fast scalps.
- Consider trailing stops once the trade moves in your favor to secure profits.
Download Now
Download the “FOREX VECTOR.ex4” indicator for Metatrader 4
FAQ
How does Forex Vector determine the arrow signals?
The indicator analyzes short-term price trends and momentum to identify optimal entry points.
Green arrows suggest upward momentum, while red arrows indicate downward momentum.
Can I use it on higher timeframes?
Yes. While it works great for scalping and intraday trading, it can also be applied to H1, H4, and daily charts for swing trading signals.
What is the best way to manage risk?
Traders can place stop losses near recent price highs/lows, minor support/resistance levels, or use a volatility-based stop such as a fraction of the ATR.
Are signals reliable in sideways markets?
The indicator is most effective in trending conditions. In ranging markets, confirm signals with additional tools like oscillators or trend filters to reduce false entries.
Summary
Forex Vector for MT4 provides clear, non-repainting green and red arrows to indicate buy and sell opportunities.
Its intuitive signals make it easy to follow and suitable for traders of all levels.
Optimized for scalping, intraday, and swing trading, the indicator helps traders act quickly on emerging trends.
Combining it with confirmation tools and proper risk management enhances accuracy, allowing traders to capture profitable moves efficiently across any currency pair or timeframe.


