About the Fractal Levels Forex Indicator
The Fractal Levels Forex Indicator for Metatrader 4 is a practical price action tool that automatically draws support and resistance levels based on fractal formations.
Instead of relying on subjective manual drawing, this indicator analyzes historical price swings and highlights key reaction zones directly on the chart.
These levels often act as decision points where price may pause, reverse, or break through with momentum.
The indicator uses the classic Fractals concept and transforms it into horizontal trading levels that remain fixed once plotted.
Blue lines represent support areas, while red lines mark resistance zones.
Because the indicator does not repaint, traders can confidently use these levels for stop loss placement, take profit targets, and breakout strategies.
Free Download
Download the “fractal-levels-indicator.ex4” MT4 indicator
Key Features
- Automatically draws support and resistance levels.
- Based on proven Fractals market behavior.
- Non-repaint indicator for reliable analysis.
- Blue levels indicate support, red levels indicate resistance.
- Useful for trade entries, exits, and risk management.
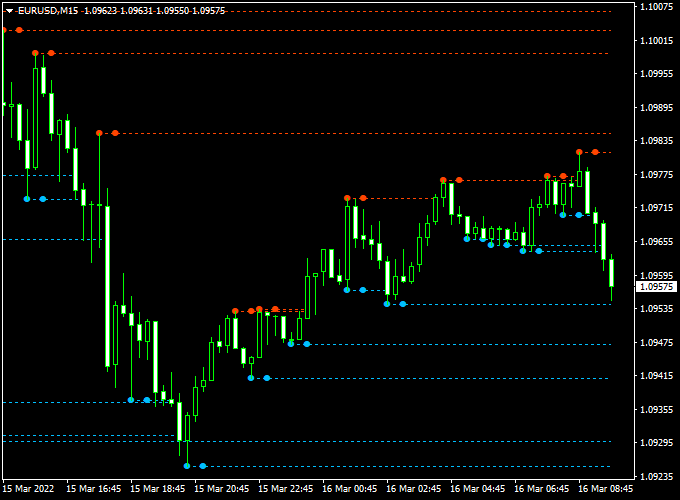
Indicator Chart
The Fractal Levels Forex Indicator is displayed directly on the main price chart.
Horizontal blue and red lines highlight important support and resistance zones derived from fractal points.
The chart clearly shows how price reacts around these levels, making breakout and rejection setups easier to identify.

Guide to Trade with Fractal Levels Forex Indicator
Buy
- Open a buy trade when price breaks and closes above the orange fractal resistance line.
- Confirm that the broader market trend is moving upwards.
Sell
- Open a sell trade when price breaks and closes below the blue fractal support line.
- Confirm that the broader market trend is moving downwards.
Stop Loss
- Place the stop loss a few pips below the nearest support level for buy trades.
- Place the stop loss a few pips above the nearest resistance level for sell trades.
Take Profit
- Set take profit near the next opposite fractal level.
- Scale out partial profits at intermediate support or resistance zones.
- Use a fixed profit target of your preference.
Fractal Levels + Silver Trend Forex Day Trading Strategy for MT4
This day-trading strategy combines the Fractal Levels Forex Indicator for MT4 and the Silver Trend MT4 Forex Indicator.
The Fractal Levels indicator gives a clear market-structure bias.
When the price is above the orange Fractal resistance line, the trend is considered bullish, and when the price breaks below the blue Fractal support line, the trend turns bearish.
The Silver Trend indicator provides entry confirmation through colored candlesticks: a blue candlestick signals a buy opportunity, while a red candlestick signals a sell opportunity.
Together, they form a robust setup for capturing intraday trend moves.
This strategy is ideal for the H1 and H4 charts and best suited to major currency pairs during active trading windows such as the London and New York overlap.
Buy Entry Rules
- Ensure price is above the orange Fractal resistance line, confirming a bullish market bias.
- Wait for a blue candlestick from the Silver Trend indicator, confirming the buy signal.
- Enter a buy trade at or just after the close of the blue candlestick.
- Place a stop-loss a few pips below the recent swing low or just below the orange Fractal line.
- Set a take-profit target at the next significant resistance level or pivot zone.
- Alternatively, exit when the Silver Trend signals a red candlestick or when the price closes below the orange Fractal line.
Sell Entry Rules
- Ensure price has broken below the blue Fractal support line, confirming a bearish market bias.
- Wait for a red candlestick from the Silver Trend indicator, confirming the sell signal.
- Enter a sell trade at or just after the close of the red candlestick.
- Place a stop-loss a few pips above the recent swing high or just above the blue Fractal line.
- Set a take-profit target at the next significant support level or pivot.
- Alternatively, exit when a blue candlestick appears or when the price closes above the blue Fractal line.
Advantages
- Clear market-structure bias via Fractal Levels indicator helps avoid counter-trend entries.
- Entry confirmation via the Silver Trend indicator reduces false signals.
- Day-trading timeframe (H1/H4) provides meaningful profit potential while limiting overnight risk.
- Simple to understand and apply, suitable for intermediate day traders.
Drawbacks
- Fewer trades may occur because both bias and entry confirmation must align.
- It may lag slightly if the Fractal line breaks occur, and then the price takes time to confirm with a candlestick.
- Requires vigilance: stop-loss and take-profit placement must be precise, especially in volatile markets.
- In low-volatility or choppy markets, the strategy may produce false signals or get stuck in small moves.
Case Study 1 – EUR/USD H1
On 3 June at 11:00 GMT, EUR/USD closed above the orange Fractal resistance line at 1.1100, establishing a bullish bias.
Shortly afterwards, the Silver Trend indicator formed a blue candlestick at 1.1104.
A buy trade was entered at 1.1105. Stop-loss was placed at 1.1089 (below the recent swing low).
The next major resistance pivot was at 1.1145.
Price moved steadily and reached 1.1144 by 16:30 GMT, generating a 39 pip profit.
The trade was closed when a red candlestick appeared, just before the price reversed.
Case Study 2 – GBP/JPY H4
On 8 June at 09:00 GMT, GBP/JPY broke below the blue Fractal support line at 154.80, confirming a bearish bias.
The Silver Trend indicator produced a red candlestick at 154.75. A sell trade was entered at 154.74.
Stop-loss was set at 155.10 (just above the Fractal line).
Price declined and reached the next support zone at 154.20 by 15:00 GMT, capturing 54 pips.
The trade was exited when a blue candlestick signalled a potential trend change.
Strategy Tips
- Monitor multiple timeframes: check H1 or H4 charts to ensure the overall trend aligns with your trade on H1.
- Focus on trades that occur near strong support or resistance levels to increase the probability of success.
- Use small lot sizes initially to test the strategy and reduce exposure while learning price reactions around Fractal levels.
- Consider partial profit-taking if the price approaches a key pivot or recent high/low, then trail the stop-loss for the remaining position.
- Keep track of average daily volatility for each currency pair to set realistic pip targets on your trades.
- Combine with basic volume analysis: higher volume at the Fractal level often increases the probability of a successful move.
- Do not force trades: if the Fractal and Silver Trend signals are not aligned, skip the trade to avoid unnecessary risk.
Download Now
Download the “fractal-levels-indicator.ex4” MT4 indicator
FAQ
How are the fractal levels calculated?
The indicator uses confirmed fractal swing points and projects them into horizontal support and resistance levels that remain fixed once formed.
Can fractal levels be used for breakout trading?
Yes, the indicator is well suited for breakout strategies when price closes beyond a fractal level with trend confirmation.
Is this indicator suitable for risk management?
Yes, many traders use fractal levels specifically for placing stop losses and defining realistic take profit zones.
Summary
The Fractal Levels Forex Indicator for MT4 simplifies support and resistance analysis by automatically plotting reliable price levels based on fractal behavior.
Its non-repaint nature allows traders to plan trades with confidence and consistency.
With clear visual levels, broad market compatibility, and practical risk management applications, this indicator is a valuable tool for traders who rely on price structure and disciplined trade planning.


