
About the Fractals Trading Signals Indicator
The Fractals Trading Signals Indicator for MT4 is designed to identify potential breakout points using fractal-based trend lines.
It plots upper and lower trend lines directly on the main MT4 chart, highlighting areas where price may move strongly in either direction.
The upper blue line signals potential bullish breakouts, while the lower pink line signals potential bearish breakouts.
Traders can use these signals to enter trades when price closes beyond the corresponding line.
The indicator works on all timeframes and currency pairs, making it versatile for scalping, intraday, and swing trading.
Free Download
Download the “fractals5-trading-signals.mq4” indicator for MT4
Key Features
- Fractal-based breakout trend lines
- The upper blue line indicates bullish breakouts
- The lower pink line indicates bearish breakouts
- Plotted directly on the main MT4 chart
- Ideal for breakout and momentum strategies
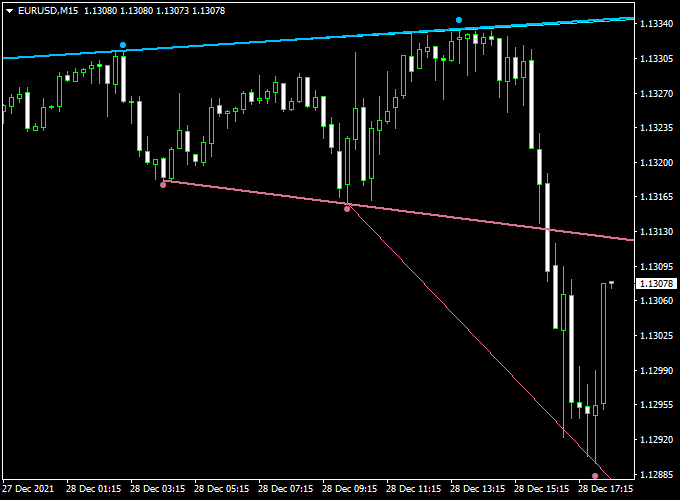
Indicator Chart
The chart shows the Fractals Trading Signals Indicator applied to MT4.
Blue and pink trend lines mark potential breakout zones.
Traders can enter buy trades above the blue line and sell trades below the pink line.
Guide to Trade with the Fractals Trading Signals Indicator
Buy Rules
- Enter a buy trade when price closes above the upper blue line
- Confirm bullish momentum
- Open at the next candle open
Sell Rules
- Enter a sell trade when price closes below the lower pink line
- Confirm bearish momentum
- Open at the next candle open
Stop Loss
- For buy trades, place a stop just below the upper blue line or the recent swing low
- For sell trades, place a stop just above the lower pink line or recent swing high
Take Profit
- Target the next significant support (for sell) or resistance (for buy)
- Use trailing stops to lock in profits
- Consider partial exits when momentum slows
- Exit fully if price reverses back inside the trend lines
Practical Tips
- Trade breakouts during high liquidity sessions
- Ignore weak breakouts with small candle bodies
- Combine with trend indicators for higher probability setups
- Practice on demo accounts to understand line behavior
Fractals Trading Signals + Wildan Trend System Breakout Day Trading Strategy for MT4
This day trading breakout strategy uses the Fractals Trading Signals Forex Indicator for MT4 together with the Wildan Trend System Forex Indicator for MT4.
The Fractals Trading Signals indicator highlights breakout levels.
A buy signal appears when the price closes above the blue upper trend line, and a sell signal appears when the price closes below the pink colored trend line.
The Wildan Trend System provides a bias filter: blue histograms indicate bullish momentum, while red histograms show bearish momentum.
Combining both tools helps traders capture clean breakouts and filter false moves on intraday charts.
Buy Entry Rules
- Wait for the price to close above the blue upper trend line on the Fractals Trading Signals Indicator.
- Confirm the Wildan Trend System Indicator histogram is blue, showing bullish momentum.
- Enter a buy trade at the breakout candle close or the next candle open.
- Place a stop loss just below the breakout level or 15–20 pips, whichever is closer.
- Set your take profit at 30–50 pips or exit when the histogram turns red.
Sell Entry Rules
- Wait for the price to close below the pink lower trend line on the Fractals Trading Signals Indicator.
- Confirm the Wildan Trend System Indicator histogram is red, showing bearish momentum.
- Enter a sell trade at the breakout candle close or the next candle open.
- Place a stop loss just above the breakout level or 15–20 pips, whichever is closer.
- Set your take profit at 30–50 pips or exit when the histogram turns blue.
Advantages
- Combines breakout levels and momentum filter for higher accuracy.
- Clear and straightforward rules for day trading setups.
- Allows traders to capture intraday swings with predefined risk and reward.
Drawbacks
- Breakouts during low liquidity sessions may lead to false signals.
- Stop losses can be triggered by quick pullbacks before the price continues.
- Requires discipline to wait for a confirmed close beyond trend lines.
Example Case Study 1 – USD/CHF 15-Minute Chart
On USD/CHF, the price closed above the blue upper trend line at 0.9085 while the Wildan Trend histogram was blue.
A buy entry at 0.9087 with a stop loss at 0.9067 (20 pips) and a take profit at 0.9135 produced a +48 pip gain within two hours of the London session.
Example Case Study 2 – AUD/JPY 5-Minute Chart
On AUD/JPY, the price closed below the pink trend line at 97.20 while the Wildan Trend histogram was red.
A sell entry at 97.18 with a stop loss at 97.38 (20 pips) and a take profit at 96.80 produced a +38 pip move during the New York open.
Strategy Tips
- Use this strategy during the London and New York sessions for stronger breakouts.
- Wait for a confirmed candle close beyond the trend lines to reduce false signals.
- Monitor major news events that can cause spikes and fake breakouts.
- Adjust your take profit based on intraday volatility, aiming for at least a 1:2 risk-to-reward ratio.
Download Now
Download the “fractals5-trading-signals.mq4” indicator for Metatrader 4
FAQ
Do the trend lines repaint?
No, once plotted, the fractal trend lines remain fixed for the period.
Which timeframe is best for breakout signals?
M15 to H1 is ideal for intraday trading, while H1–H4 works well for swing setups.
Should every breakout be traded?
No, only breakouts confirmed with momentum or trend alignment are recommended.
Summary
The Fractals Trading Signals Indicator for MT4 highlights breakout opportunities with blue and pink fractal-based trend lines.
It helps traders spot potential buy and sell trades with precision and timing.
The indicator is flexible across timeframes and pairs and works best when combined with trend confirmation or momentum tools to improve trade quality.


