About the Gimmebar Indicator
The Gimmebar indicator for MT4 is a momentum-based oscillator that provides clear buy and sell signals.
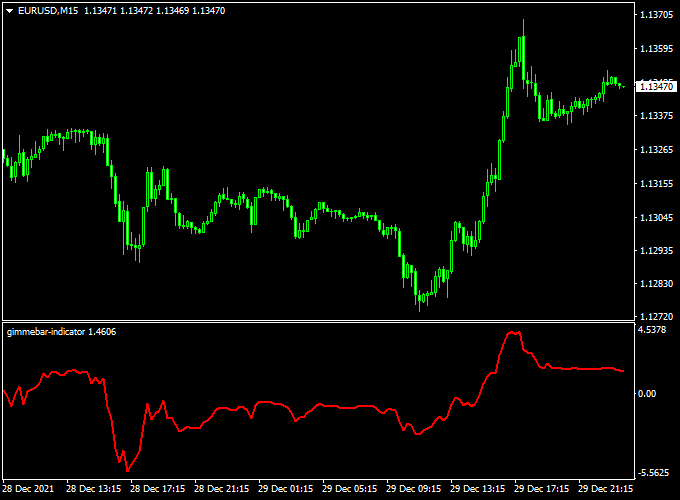
It appears in a separate MT4 chart window as a red line oscillating above and below the 0.00 midpoint.
This design makes it easy to identify trade entry and exit points based on momentum shifts.
Traders can use the Gimmebar for scalping, day trading, or as a confirmation tool for other strategies.
When the red line crosses the 0.00 midpoint from bottom to top, it indicates bullish momentum.
When it crosses from top to bottom, it signals bearish momentum.
Reversing positions on opposite signals allows traders to stay aligned with market swings.
Free Download
Download the “gimmebar-indicator.mq4” indicator for MT4
Key Features
- Red oscillator line in a separate MT4 window
- Signals trade when crossing the 0.00 midpoint
- Supports scalping, day trading, and swing trading
- Clear buy/sell and reversal signals
- Works across all MT4 timeframes and currency pairs
- Beginner-friendly and easy to interpret
Indicator Chart
The chart example shows the Gimmebar indicator on an MT4 chart.
The red oscillator line crosses the 0.00 midpoint to generate buy and sell signals.
Crosses from bottom to top indicate bullish trades, and crosses from top to bottom indicate bearish trades.

Guide to Trade with Gimmebar Indicator
Buy Rules
- Enter a buy trade when the red line crosses the 0.00 midpoint from bottom to top
- Confirm upward momentum with recent price action
- Reverse the position if a sell signal occurs
Sell Rules
- Enter a sell trade when the red line crosses the 0.00 midpoint from top to bottom
- Confirm downward momentum with recent price action
- Reverse the position if a buy signal occurs
Stop Loss
- For buy trades, set the stop loss a few pips below the last swing low
- For sell trades, set the stop loss a few pips above the last swing high
Take Profit
- Take partial profits at nearby support or resistance
- Close trades when the red line crosses 0.00 in the opposite direction
- Use trailing stops to capture extended trends
Practical Tips
- Use higher timeframes to confirm the main trend
- Focus on active market sessions for scalping and day trading
- Combine with trend indicators or moving averages for confirmation
- Stand aside during periods of low volatility when the line oscillates sideways
- Use proper risk management due to frequent reversals
GimmeBar + Ichimoku MT4 Intraday Trading Strategy
This intraday strategy combines the GimmeBar Forex Indicator MT4 and the Ichimoku Forex Indicator MT4 to capture market trends.
GimmeBar provides clear buy and sell signals based on its red signal line relative to zero, while Ichimoku confirms the trend using colored clouds.
Orange clouds indicate a bullish trend, and blue clouds indicate a bearish trend.
This setup works well on M5, M15, and M30 charts for intraday trading.
Buy Entry Rules
- Check the GimmeBar indicator: the red signal line must be above zero, indicating a buy signal.
- Confirm the trend with the Ichimoku indicator: the cloud must be orange, signaling a bullish trend.
- Enter a buy trade at the close of the confirming candle.
- Place a stop loss below the recent swing low or the bottom of the Ichimoku cloud.
- Set take profit near the next resistance level or aim for a 1:1.5 risk/reward ratio.
Sell Entry Rules
- Check the GimmeBar indicator: the red signal line must be below zero, indicating a sell signal.
- Confirm the trend with the Ichimoku indicator: the cloud must be blue, signaling a bearish trend.
- Enter a sell trade at the close of the confirming candle.
- Place a stop loss above the recent swing high or the top of the Ichimoku cloud.
- Set take profit near the next support level or aim for a 1:1.5 risk/reward ratio.
Advantages
- Combines clear entry signals with trend confirmation for reliable trades.
- Works on multiple intraday timeframes.
- Helps reduce false signals in choppy markets by requiring both indicators to align.
- Suitable for major currency pairs with tight spreads.
Drawbacks
- The strategy can give late entries if the trend starts rapidly, causing smaller profits.
- False signals may occur during very volatile news spikes, even if both indicators align.
- Small intraday timeframes increase the chance of whipsaws and quick stop-outs.
- Requires constant monitoring to capture quick intraday moves, which can be stressful.
Case Study 1: EUR/USD M15 Chart
On September 5, the GimmeBar red line moved above zero, giving a buy signal.
The Ichimoku cloud turned orange at the same time.
A buy trade was entered at 1.1005, stop loss at 1.0995, and take profit at 1.1025.
The trade closed successfully within 30 minutes, netting 20 pips.
Case Study 2: GBP/USD M5 Chart
On June 7, the GimmeBar red line dropped below zero, indicating a sell signal.
The Ichimoku cloud turned blue, confirming the bearish trend.
A sell trade was entered at 1.3050, stop loss at 1.3065, and take profit at 1.3025.
The trade reached the take profit within 25 minutes, gaining 25 pips.
Strategy Tips
- Always wait for the candle to close before entering a trade to confirm the signal.
- Use major currency pairs like EUR/USD, GBP/USD, and USD/JPY for better liquidity.
- Keep lot sizes small for intraday scalps and manage risk carefully.
- Consider combining with support and resistance levels to enhance entries and exits.
Download Now
Download the “gimmebar-indicator.mq4” indicator for Metatrader 4
FAQ
Can I use the Gimmebar for swing trading?
Yes. While ideal for scalping and day trading, it can be applied to longer timeframes to capture swing moves with trend confirmation.
How do I avoid false signals during choppy markets?
Avoid trading when the red line oscillates sideways near the 0.00 midpoint. Combine with trend indicators or higher timeframe analysis for confirmation.
Can I use this indicator for position reversals?
Yes. Reversals are triggered when the red line crosses the 0.00 midpoint in the opposite direction. Confirm with price action for safer entries.
Summary
The Gimmebar indicator for MT4 is a simple and effective oscillator for trading momentum-based entries and exits.
Its red line crossing the 0.00 midpoint provides clear buy, sell, and reversal signals suitable for scalping and day trading.
The indicator works well when combined with trend-following tools like moving averages or channel indicators.
This combination helps confirm momentum direction and increases the accuracy of trade entries.
With disciplined execution and proper risk management, the Gimmebar indicator can be a reliable addition to any MT4 trading strategy.


