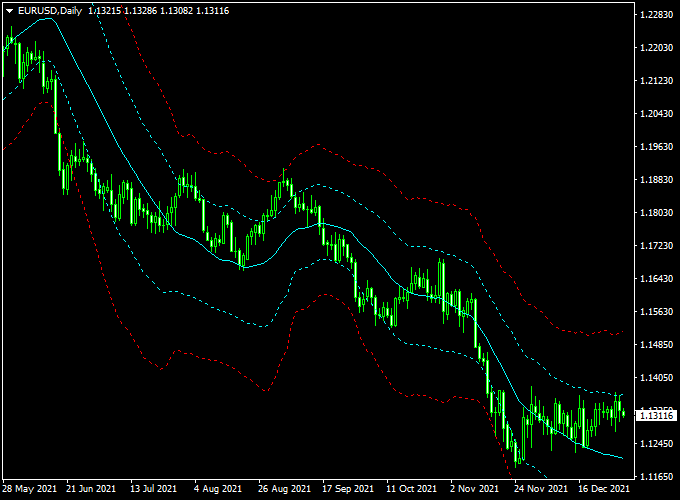
The Graf Analysis indicator for MT4 (Metatrader 4) draws a trend channel on the chart that’s based on the Graf analysis trading method.
The trend channel appears in the main chart window.
Buy & Sell Trade Example
- Open a buy trade as soon as price touches the lower red channel band and the Graf Analysis channel is trending up.
- Open a sell trade as soon as price touches the upper red channel band and the Graf Analysis channel is trending down.
The indicator works equally well on all assets (Forex, CFD stocks, Indices, Cryptocurrencies, Commodities,..) and shows promising results if used correctly.
Free Download
Download the “graf-analysis.mq4” indicator for MT4
Indicator Chart (EUR/USD Daily)
The example chart below displays the Graf Analysis mt4 indicator in action on the trading chart.
Trading Tips:
Feel free to utilize your own favorite trade entry, stop loss and take profit method to trade with the Graf Analysis indicator.
As always, trade in agreement with the overall trend and practice on a demo account first until you fully understand this indicator.
Please note that even the best trading indicator cannot yield a 100% win rate over long periods.
Indicator Specifications & Inputs:
Trading Platform: Developed for Metatrader 4 (MT4)
Currency pairs: Works for any pair
Time frames: Works for any time frame
Input Parameters: Variable (inputs tab), color settings & style
Indicator type: Channel
Repaint? No.
Graf Analysis + Pips Hunter Intraday Strategy — MT4
Introduction
This MT4 intraday strategy combines the Graf Analysis Forex Indicator with the Pips Hunter Indicator.
The Graf Analysis indicator shows an upward-sloping channel for bullish trends and a downward-sloping channel for bearish trends.
The Pips Hunter Indicator generates blue arrows for buy signals and red arrows for sell signals.
Using both indicators together provides precise intraday entry points aligned with the market trend.
This strategy works best on 5-minute to 15-minute charts and is suitable for currency pairs such as EUR/USD, GBP/USD, and USD/JPY.
Why this combo works
The Graf Analysis indicator identifies the prevailing trend, while the Pips Hunter indicator pinpoints entry signals.
Aligning both reduces false entries and increases the probability of profitable trades during intraday sessions.
Buy Entry Rules
- Graf Analysis shows an upward-sloping channel (bullish trend).
- Pips Hunter Indicator displays a blue arrow.
- Enter at the close of the candle where the blue arrow appears.
- Stop loss: 5–10 pips below the recent swing low.
- Take profit: 10–20 pips depending on pair volatility and timeframe.
Sell Entry Rules
- Graf Analysis shows a downward sloping channel (bearish trend).
- Pips Hunter Indicator displays a red arrow.
- Enter at the close of the candle where the red arrow appears.
- Stop loss: 5–10 pips above the recent swing high.
- Take profit: 10–20 pips depending on pair volatility and timeframe.
Advantages
- Clear entry signals combining trend analysis with precise arrows.
- Suitable for intraday scalping and short-term trades.
- Can be applied to various currency pairs and timeframes.
Drawbacks
- May produce false signals in choppy or low volatility markets.
- Requires active monitoring due to fast intraday movements.
- Performance depends on quick execution and low spreads.
Example Case Study 1 — EUR/USD, 5-Minute
Timeframe: 5M. Pair: EUR/USD. Session: London open.
Graf Analysis shows upward upward-sloping channel, Pips Hunter displays a blue arrow.
Entry: 1.1005. Stop loss: 1.0995 (10 pips). Take profit: 1.1020 (15 pips).
Trade closed successfully.
Example Case Study 2 — GBP/USD, 15-Minute
Timeframe: 15M. Pair: GBP/USD. Session: New York overlap.
Graf Analysis shows a downward-sloping channel, and Pips Hunter displays a red arrow.
Entry: 1.2715. Stop loss: 1.2725 (10 pips). Take profit: 1.2700 (15 pips).
Trade closed at the target.
Strategy Tips
- Trade during active sessions for higher liquidity.
- Combine with other indicators or price action for confirmation.
- Always use proper risk management, including stop losses and appropriate lot sizes.
- Backtest on different pairs and sessions to optimize settings.


