
About the Grucha Trend Moving Averages Indicator
The Grucha Trend Moving Averages indicator for MT4 is a trend-following tool that uses moving averages to plot a colored trend rainbow directly on the main chart.
The rainbow changes with market momentum.
When the candlestick crosses the rainbow from bottom to top, it signals a buy. When the candlestick crosses from top to bottom, it signals a sell.
This visual approach helps traders quickly identify trend direction and potential entry points.
Free Download
Download the “GruchaChannel.mq4” indicator for MT4
Key Features
- Trend-following rainbow plotted on the main chart
- Signals buy when the price crosses the rainbow bottom-up
- Signals sell when the price crosses the rainbow top-down
- Works on all MT4 timeframes and currency pairs
- Helps identify trend direction and potential entries
Indicator Chart
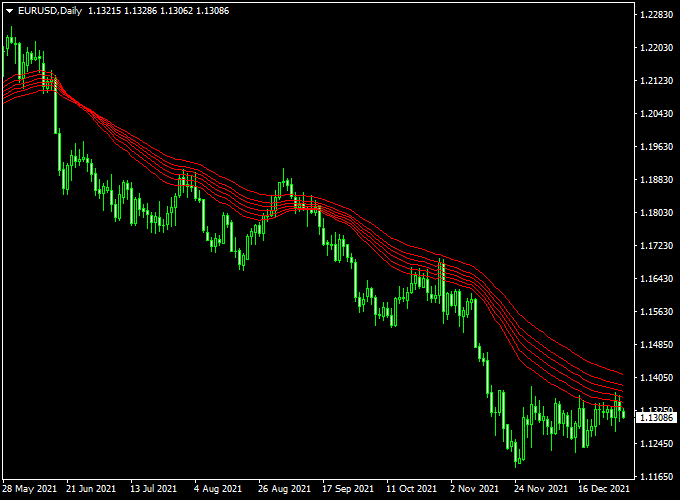
The chart shows the Grucha Trend Moving Averages rainbow on an MT4 chart.
Candlesticks crossing the rainbow bottom-up indicate buy opportunities.
Candlesticks crossing the rainbow top-down indicate sell opportunities.
Traders can use the rainbow to time entries, exits, and trend-following trades with confidence.
Guide to Trade with Grucha Trend Moving Averages Indicator
Buy Rules
- Enter a buy trade when a candlestick crosses the rainbow from bottom to top
- Confirm trend momentum with the rainbow slope
- Exit or reverse if the candlestick crosses back downward
Sell Rules
- Enter a sell trade when a candlestick crosses the rainbow from top to bottom
- Confirm trend momentum with the rainbow slope
- Exit or reverse if the candlestick crosses back upward
Stop Loss
- For buy trades, place a stop just below the rainbow or recent swing low
- For sell trades, place a stop just above the rainbow or recent swing high
Take Profit
- Close trades when the price crosses the rainbow in the opposite direction
- Take partial profits at nearby support/resistance levels
- Use trailing stops for extended trends
Practical Tips
- Enter trades only when price crosses the rainbow clearly
- Use nearby swing highs/lows to adjust stop loss
- Take partial profits near support or resistance levels
- Focus on pairs showing strong trending momentum
Grucha Trend Moving Averages + Trend Predictor v1.0 Day MT4 Trading Strategy
This MT4 day trading strategy combines the Grucha Trend Moving Averages Forex Indicator with the Trend Predictor v1.0 Indicator.
The Grucha indicator determines the market trend: bullish when the price is above the red moving averages and bearish when below.
The Trend Predictor provides blue arrows for buy signals and red arrows for sell signals.
This combination gives precise intraday entries aligned with the trend.
This strategy works best on 15-minute to 1-hour charts and is suitable for major and minor currency pairs like AUD/USD, USD/CHF, and EUR/GBP.
Why this combo works
The Grucha Trend Moving Averages clearly define the current trend, while the Trend Predictor offers actionable buy/sell signals.
Using both together filters false signals and allows traders to enter trades in the direction of the prevailing trend.
Buy Entry Rules
- Price is above the red Grucha moving averages (bullish trend confirmed).
- Trend Predictor displays a blue arrow (buy signal).
- Enter at the close of the confirming candle.
- Stop loss: place below the recent swing low.
- Take profit: exit when the price closes below the Grucha moving averages or at a previous significant resistance level.
Sell Entry Rules
- Price is below the red Grucha moving averages (bearish trend confirmed).
- Trend Predictor displays a red arrow (sell signal).
- Enter at the close of the confirming candle.
- Stop loss: place above the recent swing high.
- Take profit: exit when the price closes above the Grucha moving averages or at a previous significant support level.
Advantages
- Clear trend identification with Grucha moving averages.
- Precise entry signals from Trend Predictor v1.0.
- Flexible for multiple currency pairs and timeframes.
Drawbacks
- Lagging indicators can result in delayed signals during rapid market moves.
- False signals may appear in sideways or low-volatility markets.
- Requires active monitoring for timely execution of trades.
- Not suitable for high-impact news events without proper adjustment.
- Taking profit based on trend exit can sometimes result in smaller gains if the trend reverses quickly.
Example Case Study 1 — EUR/GBP, 30-Minute
Timeframe: 30M. Pair: EUR/GBP. Session: London open.
Price above the red Grucha moving averages, Trend Predictor displays a blue arrow.
Entry: 0.8805. Stop loss: 0.8795.
Take profit: exit when the price closes below the moving averages at 0.8830.
Trade closed successfully.
Example Case Study 2 — USD/JPY, 1-Hour
Timeframe: 1H. Pair: USD/JPY. Session: New York.
Price below the red Grucha moving averages, Trend Predictor displays a red arrow.
Entry: 144.50. Stop loss: 144.80.
Take profit: exit when the price closes above the moving averages at 144.00.
Trade closed at the target.
Strategy Tips
- Focus on strong trend sessions and avoid trading during low volatility periods.
- Combine with support and resistance levels or Fibonacci retracements for better exit points.
- Adjust position size according to account risk and volatility of the pair.
- Monitor economic calendar events to avoid trading during high-impact news releases.
Download Now
Download the “GruchaChannel.mq4” indicator for Metatrader 4
FAQ
How do I know when the trend is strong?
Check the slope of the rainbow. A steep slope indicates a strong trend, while a flat rainbow signals consolidation.
Can I trade multiple currency pairs at the same time?
Yes. The rainbow works on all pairs, but focus on those with clear trending behavior for best results.
What if the candlestick crosses the rainbow multiple times?
Avoid trading in choppy or sideways markets. Wait for a clear breakout in one direction.
Summary
The Grucha Trend Moving Averages indicator for MT4 provides a colorful trend rainbow that helps traders spot clear buy and sell signals.
It simplifies trend-following by showing when price crosses the rainbow, making entry and exit decisions easier.
When used with other indicators or higher timeframe analysis, it improves trade accuracy and confidence.


