
About the Haos Visual Signal Generator Indicator
The Haos Visual Signal Generator Indicator is a sophisticated technical oscillator designed for the Metatrader 4 platform.
It functions as a comprehensive momentum and trend-tracking system by utilizing a multi-layered histogram and a dedicated signal line.
When the histogram remains above this central threshold, the prevailing sentiment is considered bullish, while values below the zero line indicate a bearish grip on the market.
This indicator is particularly valued for its ability to identify high-probability entry points through “buy on dips” and “sell on rallies” logic.
It tracks market extremes using -50 and 50 levels, helping traders visualize when a trend is overextended or ready for a correction.
By combining histogram colors with a light brown signal line, it offers a deep look into market rhythm.
Free Download
Download the “haos-visual.ex4” MT4 indicator
Key Features
- The indicator features a color-coded histogram that identifies trend direction.
- A light brown signal line tracks momentum between -50 and 50 extremes.
- The zero-line level provides an immediate filter for bullish or bearish bias.
- The tool generates specific signals for entering trades during market retracements.
Indicator Chart
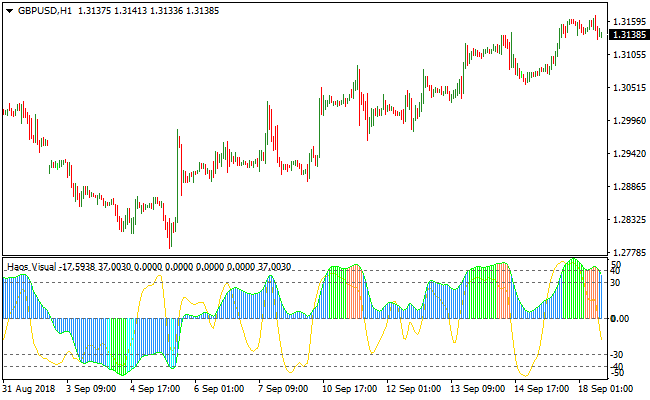
The chart displays the Haos Visual Signal Generator Indicator in a separate window below the price action.
You can see the multi-colored histogram bars fluctuating above and below the zero line, indicating the strength of the current trend.
The light brown signal line moves through the histogram, crossing the extreme -50 and 50 levels to provide precise timing for entries when the market pulls back from its peak.
Guide to Trade with Haos Visual Signal Generator Indicator
Buy Rules
- Ensure the price histogram bars are positioned above the zero-line level.
- Wait for the light brown signal line to drop toward or below the -50 extreme.
- Enter a long position when the signal line crosses back above -50 from below.
- Confirm the histogram color remains bullish to support the upward move.
Sell Rules
- Ensure the price histogram bars are positioned below the zero-line level.
- Wait for the light brown signal line to rise toward or above the 50 extreme.
- Enter a short position when the signal line crosses back below 50 from above.
- Confirm the histogram color remains bearish to support the downward move.
Stop Loss
- Place the stop loss a few pips below the most recent support level for buy trades.
- Position the stop loss a few pips above the most recent resistance for sell trades.
- Maintain a consistent exit strategy based on the current timeframe volatility.
Take Profit
- Close the position when the histogram bars move to the opposite side of the zero line.
- Exit the trade if the signal line reaches the opposite extreme level.
- Use a trailing stop to capture maximum gains during strong trending phases.
HAOS Visual Signal Generator + Brain Trend MT4 Scalping Strategy
This scalping strategy combines the HAOS Visual Signal Generator for MT4 and the Brain Trend Indicator for MT4.
The HAOS Visual Signal Generator provides clear short-term signals: initiate a buy trade when the histogram bars align above the zero line, and initiate a sell trade when the bars align below zero.
The Brain Trend Indicator confirms trend direction: a buy trend occurs when the price crosses and closes above red resistance dots, while a sell trend occurs when the price crosses and closes below blue support dots.
Using both indicators together ensures that trades are taken in the direction of short-term momentum while reducing false entries.
This strategy is best used on M1 and M5 charts, making it ideal for scalping during high-liquidity sessions.
By combining histogram-based momentum signals with trend confirmation, scalpers can identify high-probability entry points and capture small, consistent profits.
Buy Entry Rules
- HAOS Visual Signal histogram bars align above the zero line, indicating bullish momentum.
- Brain Trend price closes above the red resistance dots, confirming an upward trend.
- Enter a buy trade immediately after the confirming candle closes.
- Place a stop loss a few pips below the recent swing low or below the low of the entry candle.
- Take profit after a small fixed pip gain, typically 5–15 pips, or when either indicator signals a trend reversal.
Sell Entry Rules
- HAOS Visual Signal histogram bars align below the zero line, indicating bearish momentum.
- Brain Trend price closes below the blue support dots, confirming a downward trend.
- Enter a sell trade immediately after the confirming candle closes.
- Place a stop loss a few pips above the recent swing high or above the high of the entry candle.
- Take profit after a small fixed pip drop, typically 5–15 pips, or when either indicator signals a trend reversal.
Advantages
- Combines momentum and trend confirmation for high-probability scalping entries.
- Visual and straightforward signals make it easy to monitor multiple pairs.
- Effective on lower timeframes for fast intraday opportunities.
- Helps avoid counter-trend trades by aligning entries with short-term momentum.
- Can capture small, consistent gains across multiple trades in a single session.
- Minimal lag due to fast-responding indicators, suitable for scalping.
Drawbacks
- Limited profitability per trade; multiple winning trades are required for significant gains.
- Requires constant monitoring on fast timeframes (M1 and M5).
- Stop loss placement can be tricky in volatile market conditions.
Example Case Study 1
On EURUSD M1 during the London session, the HAOS Visual Signal histogram bars aligned above zero, and the Brain Trend price closed above red resistance dots at 1.0982.
A buy trade was entered at 1.0983 with a stop loss at 1.0978.
Price moved up to 1.0993 within 8 minutes, capturing 10 pips before the next signal appeared.
Example Case Study 2
On GBPUSD M5 during the New York session, the HAOS Visual Signal histogram bars aligned below zero, and the Brain Trend price closed below blue support dots at 1.2635.
A sell trade was entered at 1.2634 with a stop loss at 1.2640.
Price declined to 1.2622, providing 12 pips profit within 15 minutes before the next reversal signal appeared.
Strategy Tips
- Focus on major currency pairs with tight spreads for optimal scalping results.
- Trade during high-liquidity sessions such as London and New York for stronger trends.
- Use tight stop losses but give enough room to avoid being stopped out by minor market noise.
- Take profits quickly to lock in gains before reversals occur.
- Avoid trading during major news releases to prevent unpredictable volatility.
- Maintain a trading journal to track which pairs, timeframes, and sessions produce the best results.
- Be disciplined and avoid chasing trades; only enter when clear confirmation from both indicators is present.
Download Now
Download the “haos-visual.ex4” Metatrader 4 indicator
FAQ
What do the different histogram colors signify in the Haos Visual Signal Generator Indicator?
The histogram colors in the Haos Visual Signal Generator Indicator, such as blue, orange, and green, represent different stages of momentum and trend strength.
They help traders visually distinguish between a strengthening trend, a maturing trend, and a potential reversal point, providing more detail than a standard single-color oscillator.
How do the -50 and 50 extreme values help in trading?
These values act as overbought and oversold thresholds. In an uptrend, a dip below -50 suggests the market is temporarily exhausted and ready to bounce.
Conversely, in a downtrend, a move above 50 suggests a temporary rally that is likely to fail, providing a high-quality sell entry.
Is it necessary to use other indicators with this signal generator?
While the Haos Visual Signal Generator Indicator is a powerful standalone tool, it is often beneficial to combine it with price action analysis or a long-term moving average.
This ensures that you are only taking signals that align with the major market structure.
Summary
The Haos Visual Signal Generator Indicator stands out as a versatile and reliable oscillator for Metatrader 4 users.
Its primary benefit is the clear visual representation of market momentum, which helps traders avoid chasing the market at unfavorable prices.
By focusing on the relationship between the histogram and the signal line, you can effectively time your entries during retracements.


