
About the Heiken Ashi MA T3 Indicator
The Heiken Ashi MA T3 Indicator is a sophisticated trend-following tool that combines the smoothing capabilities of Heiken Ashi with the responsiveness of the T3 moving average.
Unlike standard moving averages that often suffer from significant lag, the T3 calculation provides a much smoother curve that stays tighter to price action.
By integrating this with Heiken Ashi logic, the indicator effectively filters out market noise and minor price fluctuations that often lead to false signals.
This makes it a reliable choice for traders who want to identify the core direction of a trend without being distracted by intraday volatility.
When you load this tool onto your platform, it generates clear visual cues directly on the main chart.
Free Download
Download the “heiken-ashi-ma-t3-new-indicator.ex4” MT4 indicator
Key Features
- An advanced T3 smoothing algorithm that significantly reduces signal lag.
- Intuitive dot-based signal system for instant identification of trend shifts.
- Green dots signify bullish momentum, while pink dots indicate bearish pressure.
- Works seamlessly across all timeframes, from the one-minute chart to the monthly.
- Versatile application as a standalone system or as a filter for other strategies.
Indicator Chart
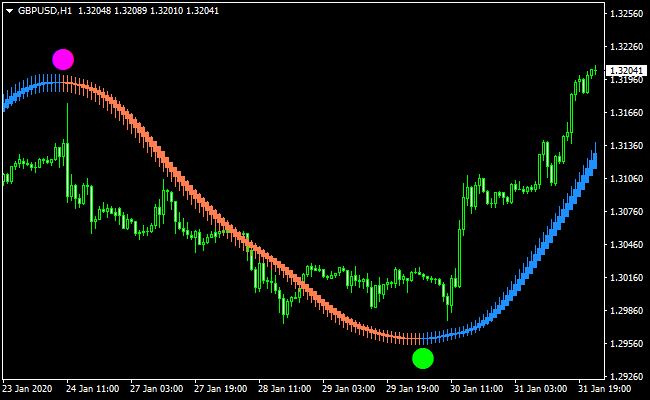
The Heiken Ashi MA T3 Indicator chart displays a series of dots that track the price movement.
When a green dot appears below the price candle, it indicates a confirmed bullish trend and a potential buy opportunity.
When a pink dot appears above the price candle, it signals a bearish trend and a potential sell opportunity.
Guide to Trade with Heiken Ashi MA T3 Indicator
Buy Rules
- Wait for the Heiken Ashi MA T3 Indicator to print a green dot below the price candlestick.
- Ensure the candle has officially closed to confirm the signal is locked in place.
- Enter the buy position at the opening of the next candle following the first green dot.
Sell Rules
- Monitor the chart for the appearance of a pink dot above the price candlestick.
- Confirm that the candlestick has closed with the pink dot remaining in position.
- Execute a sell trade at the start of the next candle after the pink signal appears.
Stop Loss
- For buy trades, place your stop loss just below the most recent green dot or swing low.
- For sell trades, position your stop loss just above the most recent pink dot or swing high.
- Adjust your stop loss as the trend progresses to protect your accumulated profits.
Take Profit
- Consider closing the trade when the indicator prints a dot of the opposite color.
- Set a fixed profit target at a major support or resistance level on the chart.
- Alternatively, use a trailing stop that follows the dots to capture the maximum trend move.
Heiken Ashi MA T3 + Trend Filter MT4 Forex Strategy
This MT4 strategy combines the Heiken Ashi MA T3 indicator with the Trend Filter indicator to provide reliable trade entries in trending markets.
The Heiken Ashi MA T3 uses green dots for bullish trends and pink dots for bearish trends, while the Trend Filter confirms the trend direction with a green line for buy signals and a red line for sell signals.
This combination is suitable for M15, M30, and H1 charts and works well for intraday and swing traders looking for trend-following setups with clear entry and exit rules.
Buy Entry Rules
- Wait for the Heiken Ashi MA T3 to show a green dot, indicating a bullish trend.
- Confirm that the Trend Filter displays a green line, signaling bullish momentum.
- Enter a buy trade at the close of the confirmation candle.
- Place a stop loss below the recent swing low. Use 15–25 pips on M15, 25–40 pips on M30/H1.
- Set a take profit between 20–40 pips on M15 or 40–70 pips on M30/H1, or trail with structure highs.
Sell Entry Rules
- Wait for the Heiken Ashi MA T3 to show a pink dot, indicating a bearish trend.
- Confirm that the Trend Filter displays a red line, signaling bearish momentum.
- Enter a sell trade at the close of the confirmation candle.
- Place a stop loss above the recent swing high. Use 15–25 pips on M15, 25–40 pips on M30/H1.
- Set a take profit between 20–40 pips on M15 or 40–70 pips on M30/H1, or trail with structure lows.
Advantages
- Clear trend signals with dot and line confirmation.
- Works on multiple timeframes and currency pairs.
- Reduces false entries during minor pullbacks.
- Easy to follow visually for beginners and experienced traders.
- Helps time entries with the overall market trend.
Drawbacks
- Requires patience for trend confirmation before entering trades.
- Not ideal for scalping on very low timeframes.
Example Case Study 1
On EURUSD M15 during the London session, the Heiken Ashi MA T3 showed a green dot after a small pullback.
The Trend Filter confirmed with a green line.
A buy trade was entered at 1.0925 with a stop loss at 1.0910.
Price trended upwards steadily and reached 1.0960 within one hour, gaining 35 pips.
Both indicators remained aligned during the move, confirming a strong bullish trend.
Example Case Study 2
On GBPJPY M30 during the New York session, the Heiken Ashi MA T3 printed a pink dot as the pair approached a resistance level.
The Trend Filter also turned red, confirming bearish momentum.
A sell trade was entered at 174.50 with a stop loss at 174.75.
The pair moved downward and hit the take profit at 173.95, gaining 55 pips.
The indicators provided clear entry and trend confirmation throughout the move.
Strategy Tips
- Trade during the London and New York sessions for better trend strength.
- Use higher timeframes for context and trend direction before taking M15 or M30 trades.
- Consider partial exits if the trend is extended to lock in profits.
- Avoid trading during high-impact news events to prevent stop-loss hits.
- Pairs like EURUSD, GBPJPY, AUDUSD, and USDJPY often provide the most reliable trends.
Download Now
Download the “heiken-ashi-ma-t3-new-indicator.ex4” Metatrader 4 indicator
FAQ
How does the T3 calculation improve this indicator?
The T3 calculation uses a multiple-stage smoothing process that reacts faster to price changes than a standard exponential moving average.
This means the Heiken Ashi MA T3 Indicator can identify trend reversals earlier, giving you a better entry price than traditional trend-following tools.
Can I change the sensitivity of the dots?
Yes, the indicator settings allow you to adjust the period and the volume factor.
A smaller period will make the dots appear more frequently and follow price more closely, while a larger period will provide a smoother trend with fewer signals.
Is this indicator suitable for gold and cryptocurrencies?
The logic behind the indicator is based on price momentum, which applies to all liquid markets.
It works effectively on gold, oil, and major cryptocurrencies, provided there is enough volume to sustain a directional trend.
Summary
The Heiken Ashi MA T3 Indicator is a powerful asset for any trader looking to simplify their chart analysis.
Its ability to provide clean, dot-based signals makes it an excellent choice for maintaining emotional discipline during fast market moves.
The main benefit of this tool is its hybrid nature, offering the stability of a moving average with the visual clarity of Heiken Ashi.
To get the best results, you might consider using it in conjunction with a higher timeframe trend filter to ensure you are only taking signals that align with the broader market direction.


