
About the High/Low Breakout Channel Indicator
The High/Low Breakout Channel indicator for MT4 helps traders spot breakout opportunities by drawing dynamic high and low channels on the chart.
It shows potential areas where price is likely to break out, making it ideal for momentum and trend traders.
The indicator prints two red lines defining the high and low levels, which adapt to market movements.
Traders can use the signals to enter buy trades when the price breaks above the upper line, or sell trades when the price breaks below the lower line.
Free Download
Download the “high-low-channel.mq4” indicator for MT4
Key Features
- Dynamic high and low breakout lines on the main chart
- Signals potential bullish and bearish breakouts
- Helps identify momentum and trend continuation points
- Easy to combine with other trend or volatility indicators
- Suitable for scalping, day trading, and swing trading
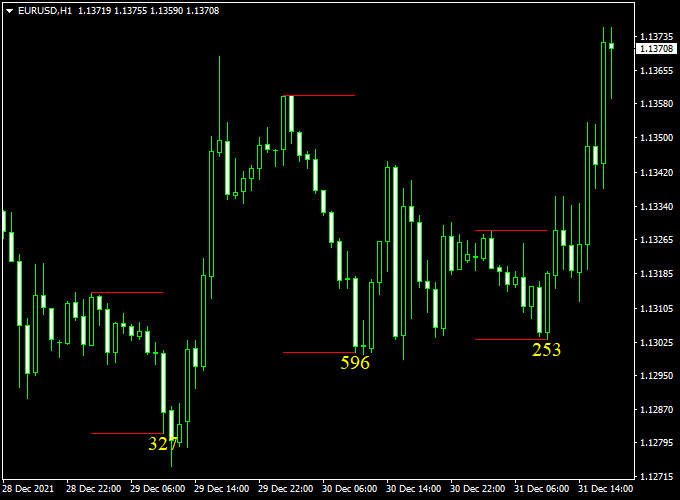
Indicator Chart
The chart shows the High/Low Breakout Channel indicator with two red lines defining the high and low levels.
Price closing above the upper line signals a potential buy, while closing below the lower line signals a potential sell.
Traders can use this visual setup to time breakouts and manage entries efficiently.
Guide to Trade with High/Low Breakout Channel Indicator
Buy Rules
- Open a buy trade when the candlestick closes above the upper red line
- Confirm breakout momentum with volume or trend indicators
- Close or reverse if the price drops below the upper line
Sell Rules
- Open a sell trade when the candlestick closes below the lower red line
- Confirm breakout strength with volume or trend indicators
- Close or reverse if the price rises above the lower line
Stop Loss
- Buy: just below the upper breakout line or recent support
- Sell: just above the lower breakout line or recent resistance
- Widen in volatile sessions, tighten in calm markets
Take Profit
- Target the next support or resistance level
- Use partial profits at key levels
- Consider trailing stops to follow extended breakouts
Practical Tips
- Wait for full candle closes to confirm breakouts
- Avoid trading in low liquidity periods
- Adjust risk size according to market volatility
- Track breakouts across multiple timeframes for confirmation
Scalping Strategy: High Low Breakout Channel + Sibbet Demand Index Divergence (MT4)
This scalping strategy combines the High Low Breakout Channel Indicator and the Sibbet Demand Index Divergence Indicator to identify high-probability breakout opportunities.
The High Low Breakout Channel Indicator defines key support and resistance levels, while the Sibbet Demand Index Divergence Indicator confirms market momentum through volume analysis.
This strategy is suitable for 1-minute to 5-minute charts, ideal for active intraday scalpers.
Buy Entry Rules
- Wait for the price to break above the upper breakout line of the High Low Breakout Channel Indicator, indicating a potential bullish breakout.
- Ensure the Sibbet Demand Index Divergence Indicator turns green, confirming strong buying momentum.
- Enter a buy trade at the close of the candle that confirms both conditions.
- Set the stop loss just below the most recent swing low or a significant support level.
- Set the take profit at a 1:1.5 reward-to-risk ratio, or exit when the Sibbet Demand Index Divergence Indicator turns red.
Sell Entry Rules
- Wait for the price to break below the lower breakout line of the High Low Breakout Channel Indicator, indicating a potential bearish breakout.
- Ensure the Sibbet Demand Index Divergence Indicator turns red, confirming strong selling pressure.
- Enter a sell trade at the close of the candle that confirms both conditions.
- Set the stop loss just above the most recent swing high or a significant resistance level.
- Set the take profit at a 1:1.5 reward-to-risk ratio, or exit when the Sibbet Demand Index Divergence Indicator turns green.
Advantages
- Combines breakout levels with volume-based momentum for high-probability entries.
- Clear entry and exit signals reduce decision-making time.
- Suitable for quick, intraday trades on short timeframes.
- Adaptable to various currency pairs and market conditions.
- Enhances trading discipline by providing structured rules.
Drawbacks
- Stop losses can be hit prematurely if sudden spikes occur, particularly around news releases.
- Performance may vary across currency pairs; some pairs may experience frequent whipsaws.
- Scalping profits per trade are relatively small, requiring strict risk management and multiple successful trades for consistent gains.
- High spread or slippage during volatile market conditions can reduce profitability.
Case Study 1
On the EUR/USD 1-minute chart, the price broke above the upper breakout line of the High Low Breakout Channel Indicator, signaling a potential buy.
The Sibbet Demand Index Divergence Indicator turned green, confirming bullish momentum.
A buy trade was executed at 1.1850, with a stop loss at 1.1840 and a take profit at 1.1865.
The trade reached the take profit level within 10 minutes, yielding a 15-pip gain.
Case Study 2
On the GBP/USD 5-minute chart, the price broke below the lower breakout line of the High Low Breakout Channel Indicator, indicating a potential sell.
The Sibbet Demand Index Divergence Indicator turned red, confirming bearish pressure.
A sell trade was entered at 1.3500, with a stop loss at 1.3520 and a take profit at 1.3480.
The trade hit the take profit level within 15 minutes, resulting in a 20-pip profit.
Strategy Tips
- Trade primarily during high-liquidity sessions, such as London and New York overlaps, to reduce slippage and ensure reliable breakouts.
- Use currency pairs with tight spreads and low slippage, such as EUR/USD, GBP/USD, USD/JPY, and AUD/USD, for maximum scalping efficiency.
- Combine with support and resistance levels, pivot points, or previous highs/lows to filter fake breakouts and improve entries.
- Use smaller position sizes to limit risk, especially when multiple breakout trades are taken in quick succession.
- Apply a trailing stop to lock in profits when the price moves strongly in your favor after a breakout.
- Be patient and disciplined—wait for the breakout to close beyond the channel line with momentum confirmation before entering.
Download Now
Download the “high-low-channel.mq4” indicator for Metatrader 4
FAQ
How do I know a breakout is real?
Wait for the candlestick to close above or below the breakout line. Confirmation from volume or momentum helps filter false breakouts.
Can I use it on multiple pairs?
Yes. The indicator adapts to any currency pair or trading instrument in MT4.
Which timeframes work best?
It works on all timeframes. Higher timeframes reduce noise; lower timeframes are better for fast breakout trades.
Can I combine it with other tools?
Yes. Use it with trend, volume, or volatility indicators to improve entry and exit timing.
Summary
The High/Low Breakout Channel indicator for MT4 draws adaptive high and low lines to highlight potential breakout zones.
It helps traders identify when price is breaking key levels, giving early signals for both buy and sell opportunities.
This tool works across all currency pairs and timeframes, supporting scalping, day trading, and swing strategies.
Combined with trend or volume indicators, it improves trade precision and risk management, making breakout trading simpler and more efficient.


