About the Ichimoku Trend Monitor with Alert Indicator
The Ichimoku Trend Monitor with Alert for MT4 is a directional trend indicator that delivers clear trade signals across multiple timeframes.
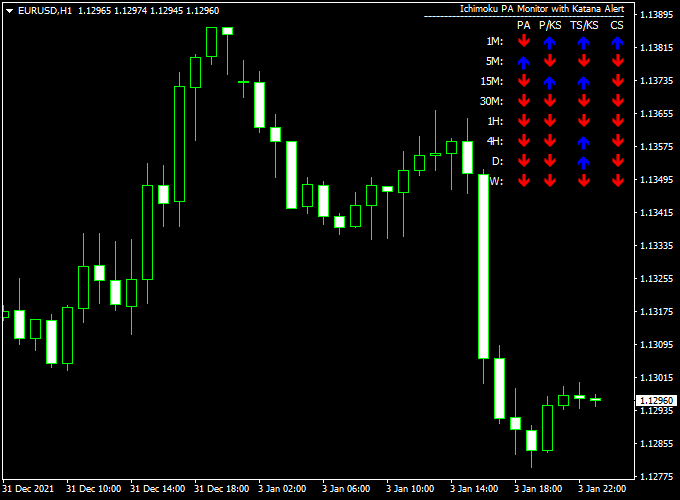
The indicator displays all signal arrows on a compact dashboard, allowing traders to see when the market is strongly bullish or bearish at a glance.
It is designed for traders of all experience levels, providing straightforward entry signals without complicated setups.
By showing trend direction for your chosen timeframe, this tool helps traders enter trades with confidence and exit when conditions change.
It works with any currency pair and timeframe, making it versatile for both day trading and swing trading.
Free Download
Download the “Ichimoku_Monitor.ex4” indicator for MT4
Key Features
- Displays all Ichimoku trend signals in a dashboard for easy reading
- Blue arrows indicate bullish signals, red arrows indicate bearish signals
- Alerts notify traders when a complete trend signal appears
- Can be combined with other indicators for improved accuracy
Indicator Chart
The chart below shows the Ichimoku Trend Monitor with Alert in action.
The dashboard displays blue arrows for strong buy signals and red arrows for strong sell signals.
Traders can rely on these signals for trend-aligned entries and exits.

Guide to Trade with Ichimoku Trend Monitor with Alert Indicator
Buy Rules
- Enter a buy trade when all arrows on the dashboard turn blue for your chosen timeframe
- Confirm trend direction with price action or support levels if desired
- Close or reverse the trade when all arrows turn red
Sell Rules
- Enter a sell trade when all arrows on the dashboard turn red for your chosen timeframe
- Confirm trend direction with resistance or downward momentum
- Close or reverse the trade when all arrows turn blue
Stop Loss
- Place below the lowest recent swing for buy trades
- Place above the highest recent swing for sell trades
- Alternatively, set a fixed pip buffer beyond the trend signal for safer trades
Take Profit
- Target the next support/resistance level for partial exits
- Or exit when the dashboard shows a trend reversal
- Optionally, trail stops following trend swings to lock in profits
Practical Tips
- Combine with support/resistance or momentum indicators for stronger entries
- Pay attention to dashboard alerts to time trades efficiently
- Follow the trend indicated by all arrows for higher probability trades
Ichimoku Trend Monitor + 2 Candles Reversal MT4 Scalping Strategy
This scalping strategy combines the Ichimoku Trend Monitor with Alert for MT4 with the 2 Candles Forex Reversal Signal Indicator for MT4.
The system is designed for fast intraday trading, using trend confirmation from the Ichimoku monitor and precise reversal signals from the 2 Candles indicator.
The Ichimoku Trend Monitor shows arrows in a dashboard for your selected timeframe.
When all arrows are blue, the market is bullish. When all arrows turn red, the trend is bearish.
The 2 Candles Forex Reversal Signal indicator identifies short-term reversals.
Red arrows indicate a buy setup, while blue arrows signal a sell opportunity.
By trading only when both indicators align, traders can improve accuracy and reduce false entries during scalping.
This strategy works best on M5 and M15 charts and is suitable for active forex pairs such as AUDUSD, NZDUSD, and USDCAD.
It is ideal for traders who prefer quick entries, clear trend confirmation, and structured exits during intraday sessions.
Buy Entry Rules
- Wait for all Ichimoku Trend Monitor arrows on your timeframe to turn blue, confirming a bullish trend.
- Look for a red buy arrow from the 2 Candles Reversal Signal indicator.
- Enter a buy trade at the open of the next candle after both conditions are met.
- Place a stop loss below the most recent swing low or the nearest support level.
- Set take profit at 1.5 to 2 times the stop loss distance, or exit if Ichimoku arrows turn mostly red.
Sell Entry Rules
- Wait for all Ichimoku Trend Monitor arrows to turn red, confirming a bearish trend.
- Look for a blue sell arrow from the 2 Candles Reversal Signal indicator.
- Enter a sell trade at the open of the next candle after both conditions are met.
- Place a stop loss above the most recent swing high or the nearest resistance level.
- Set take profit at 1.5 to 2 times the stop loss distance, or exit if Ichimoku arrows turn mostly blue.
Advantages
- Combines trend confirmation with reversal timing for accurate scalping entries.
- Visual dashboard and arrows make trade setups easy to identify.
- Effective for short intraday timeframes like M5 and M15.
- Reduces false entries by requiring both indicators to align.
- Applicable to multiple currency pairs.
Drawbacks
- Less effective in choppy or sideways markets.
- Requires quick reactions and attention for optimal scalping.
- Signals can lag slightly in very volatile conditions.
- Stop loss and take profit placement are essential for consistent results.
- Missed trades can occur if the price moves too fast between signals.
Example Case Study 1
On the AUDUSD M5 chart, all Ichimoku arrows turned blue while the 2 Candles indicator showed a red buy arrow.
A buy trade was entered at 0.6752 with a stop loss at 0.6745 and a take profit at 0.6765.
The trade captured 13 pips within 20 minutes before the Ichimoku arrows changed, demonstrating the accuracy of the combined trend and reversal signals.
Example Case Study 2
On the NZDUSD M15 chart, all Ichimoku arrows turned red, and a blue sell arrow appeared on the 2 Candles indicator.
A sell trade was opened at 0.6185 with a stop loss at 0.6195 and a take profit at 0.6170.
The trade reached the target within 30 minutes, yielding 15 pips.
This setup shows how the strategy can efficiently capture short-term intraday moves using alignment between trend and reversal signals.
Strategy Tips
- Focus on M5 and M15 charts for scalping opportunities.
- Trade only when both Ichimoku arrows and 2 Candles arrows align to avoid false signals.
- Avoid trading during major news events or low liquidity periods.
- Consider partial exits or trailing stops for strong moves.
- Backtest the strategy on multiple pairs to optimize settings for your preferred market.
Download Now
Download the “Ichimoku_Monitor.ex4” indicator for Metatrader 4
FAQ
What makes the Ichimoku Trend Monitor different from other indicators?
Unlike standard Ichimoku tools, this indicator consolidates signals from multiple lines into a single dashboard with arrows, showing clear buy and sell trends without cluttering the chart.
How reliable are the arrow signals?
Signals are most reliable when all arrows align for a single direction on your chosen timeframe.
Combining with higher timeframe trends or support/resistance zones can further reduce false entries.
Can it be used for scalping or long-term trades?
Yes. For scalping, use lower timeframes and confirm with price action.
For swing trades, use higher timeframes and wait for strong arrow alignment.
Do I need to monitor the chart constantly?
No. Alerts notify you when all arrows align, making it easier to manage trades without staring at the screen all day.
Summary
The Ichimoku Trend Monitor with Alert Indicator is a compact and effective tool for tracking market trends across any timeframe.
Displaying blue and red arrows on a dashboard provides clear signals for both buy and sell trades, helping traders act decisively and confidently.
Beginner-friendly yet powerful enough for advanced strategies, the indicator works across all currency pairs and MT4 timeframes.
Using the dashboard alerts, traders can follow strong trend movements, combine with other technical tools for confirmation, and manage risk with precise entries and exits.
This indicator simplifies trend trading and enhances overall trading efficiency.


