
About the Inside Bar Breakout Signal Indicator
The Inside Bar Breakout Signal Indicator, also known as the StrategyQuant Signal indicator for Metatrader 4, is a breakout-based trading tool that focuses on inside bar price action setups.
Inside bars represent short periods of consolidation where price trades within the range of the previous candle, often preceding strong directional moves.
This indicator automatically detects inside bar breakouts and generates trade signals once price breaks beyond the inside bar range.
Unlike manual breakout systems, the signal logic eliminates guesswork and enables traders to react quickly when momentum enters the market.
The indicator appears directly in the main MT4 chart window as red signal dots.
These dots indicate potential long and short breakout opportunities after price confirms a breakout beyond the inside bar levels.
The indicator does not repaint, ensuring that signals remain fixed once they appear.
Free Download
Download the “InsideBarBreakout.mq4” indicator for MT4
Key Features
- Automatic detection of inside bar breakout setups
- Red signal dots for both buy and sell opportunities
- Signals plotted directly on the MT4 price chart
- Non-repainting signal logic based on closed candles
- Ideal for breakout and momentum trading strategies
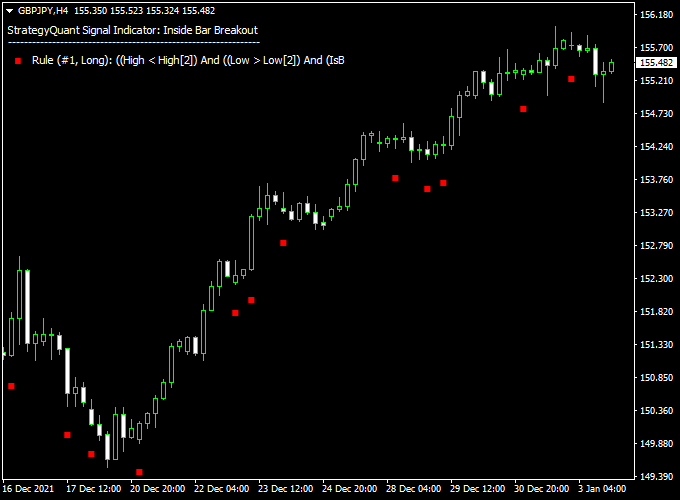
Indicator Chart
The chart shows the Inside Bar Breakout Signal Indicator applied to an MT4 price chart.
Red signal dots appear on the chart when price breaks out of an inside bar formation.
Each dot highlights a potential trade entry after breakout confirmation, allowing traders to quickly identify momentum-driven opportunities.
Guide to Trade with the Inside Bar Breakout Signal Indicator
Buy Rules
- Wait for a red signal dot to appear after an inside bar breakout
- Confirm that the broader market direction is bullish
- Enter a buy trade at the close of the breakout candle
Sell Rules
- Allow the indicator to generate a signal dot after a downside breakout
- Confirm that the overall market direction is bearish
- Enter a sell trade once the breakout candle has closed
Stop Loss
- Place the stop loss above the inside bar high for sell trades
- For buy trades, place the stop loss below the inside bar low
- Add a small pip buffer to reduce the impact of spread and noise
Take Profit
- Close the trade when an opposite breakout signal appears
- Scale out part of the position after the first strong impulse move
- Let the remaining position run until momentum weakens
Practical Tips
- Focus on signals that align with the higher timeframe trend
- Breakouts during the London and New York sessions often perform better
- Avoid trading signals that appear during very tight ranges
Inside Bar Breakout with BOS & CHoCH MT4 Strategy
This strategy leverages two MT4 indicators to identify breakout opportunities with confirmation from market structure shifts.
The Inside Bar Breakout Signal Indicator detects potential breakout points, while the BOS & CHoCH Indicator confirms changes in market structure, enhancing the reliability of trade entries.
Suitable for traders on M15, M30, and H1 timeframes, this strategy is ideal for those seeking to trade breakouts with added confirmation to reduce false signals.
Buy Entry Rules
- Wait for the Inside Bar Breakout Signal Indicator to plot a red dot, indicating an inside bar formation.
- Confirm that the BOS & CHoCH Indicator shows a Break of Structure (BOS) to the upside, signaling a potential trend continuation.
- Enter a buy trade at the close of the candle that breaks above the inside bar’s high.
- Set a stop loss just below the low of the inside bar.
- Set take profit at the nearest resistance level, or exit when the BOS & CHoCH Indicator signals a potential structure change or trend reversal.
Sell Entry Rules
- Wait for the Inside Bar Breakout Signal Indicator to plot a red dot, indicating an inside bar formation.
- Confirm that the BOS & CHoCH Indicator shows a Break of Structure (BOS) to the downside, signaling a potential trend continuation.
- Enter a sell trade at the close of the candle that breaks below the inside bar’s low.
- Set a stop loss just above the high of the inside bar.
- Set take profit at the nearest support level, or exit when the BOS & CHoCH Indicator signals a potential structure change or trend reversal.
Advantages
- Combines price action (inside bars) with market structure analysis (BOS & CHoCH) for higher accuracy.
- Reduces the likelihood of false breakouts by confirming trend direction.
- Applicable across various timeframes, offering flexibility for different trading styles.
- Clear entry and exit rules, suitable for both novice and experienced traders.
Drawbacks
- Requires precise timing to enter trades at the right breakout points.
- May produce fewer signals, leading to periods of inactivity.
- Not suitable for highly volatile markets where breakouts may be false.
- Demands discipline to adhere to entry and exit rules without emotional interference.
Example Case Study 1
On the EUR/USD H1 chart, an inside bar formed with a red dot from the Inside Bar Breakout Signal Indicator.
The BOS & CHoCH Indicator confirmed a Break of Structure to the upside.
A buy trade was entered at 1.1050, with a stop loss at 1.1020 and a take profit at 1.1110.
The trade was successful, capturing 60 pips.
Example Case Study 2
On the GBP/USD M30 chart, an inside bar appeared with a red dot from the Inside Bar Breakout Signal Indicator.
The BOS & CHoCH Indicator confirmed a Break of Structure to the downside.
A sell trade was executed at 1.3150, with a stop loss at 1.3180 and a take profit at 1.3080.
The trade yielded 70 pips.
Strategy Tips
- Always wait for confirmation from the BOS & CHoCH Indicator before entering a trade.
- Use a risk-reward ratio of at least 1:2 to ensure favorable trade outcomes.
- Avoid trading during major news events that can cause erratic price movements.
- Regularly backtest the strategy to adapt to changing market conditions.
- Combine this strategy with other tools like support and resistance levels for enhanced decision-making.
Download Now
Download the “InsideBarBreakout.mq4” indicator for Metatrader 4
FAQ
How is this indicator different from a standard inside bar tool?
This version focuses on confirmed breakout signals and plots clear signal dots only after price closes beyond the inside bar range, reducing early or speculative entries.
Are alerts available with this indicator?
Yes. The indicator is designed to alert traders when a valid inside bar breakout signal appears, making it suitable for active and part-time traders.
Does the indicator work well on volatile pairs?
It performs particularly well on pairs that show strong session-based volatility, such as GBP and JPY crosses, where breakouts tend to follow through more often.
Should trades be taken immediately when a signal appears?
Signals work best when confirmed by market context. Waiting for trend alignment or session momentum often improves overall results.
Summary
The Inside Bar Breakout Signal Indicator for MT4 simplifies inside bar breakout trading by delivering ready-to-use signals directly on the chart.
By focusing on confirmed candle closes, it helps traders avoid premature entries and stay aligned with real momentum.
Its signal-based design makes it easy to scan multiple charts and timeframes.
When combined with a trend-based indicator or higher timeframe direction filter, the Inside Bar Breakout Signal Indicator becomes even more effective.
This combination helps traders focus on higher-probability setups while keeping the trading process simple and repeatable.


