The iWPR+ Forex Oscillator for Metatrader 4 is an overbought/oversold technical oscillator that works great to enter and exit currency trades with great precision.
The indicator uses the 20 oversold and 80 overbought extreme values.
- The currency pair is considered oversold when it reaches the 20 iWPR+ extreme value.
- The currency pair is considered overbought when it reaches the 80 iWPR+ extreme value.
It’s recommended to combine the iWPR+ oscillator with other technical indicators or price action techniques.
In trending markets, only trade signals from the iWPR+ oscillator are used in the overall market direction.
Uptrend? Only trade the oversold iWPR+ extreme values. Avoid the overbought extreme values.
Downtrend? Only trade the overbought iWPR+ extreme values. Avoid the oversold extreme values.
Free Download
Download the “iWPR+.mq4” MT4 indicator
Indicator Chart (GBP/JPY M30)
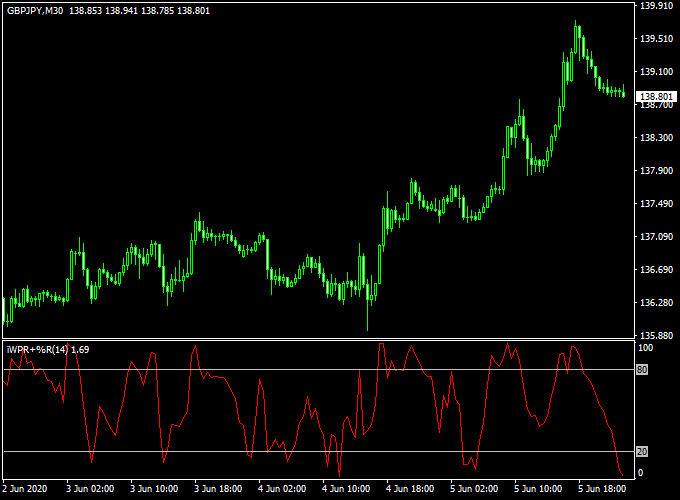
The GBP/JPY M30 chart below displays the iWPR+ Forex Oscillator Metatrader 4 forex indicator in action.
Basic Trading Signals
Signals from the iWPR+ Oscillator MT4 forex indicator are easy to interpret and go as follows:
Buy Signal: Initiate a buy trade order when the iWPR+ value crosses the 20 oversold level upwards and the overall trend direction is up.
Place a stop loss 2-3 pips below the most recent support or apply your own stop loss method.
Sell Signal: Initiate a sell trade order when the iWPR+ value crosses the 80 overbought level downwards and the overall trend direction is down.
Place a stop loss 2-3 pips above the most recent resistance level or apply your own stop loss method.
IWPR Forex Oscillator + RSI with CCI Forex Scalping Strategy
This scalping strategy combines the IWPR Forex Oscillator for MT4 with the RSI with CCI Forex Trend Indicator for MT4.
The IWPR Oscillator provides overbought and oversold signals: it generates a buy signal when the line crosses back above 20, and a sell signal when it crosses back below 80.
The RSI with CCI indicator shows trend direction with green histogram bars for bullish momentum and red bars for bearish momentum.
By combining these indicators, traders can identify short-term momentum reversals while confirming the overall trend.
This strategy works best on M5 and M15 charts, ideal for scalpers looking for fast trades in liquid markets.
Buy Entry Rules
- The IWPR Forex Oscillator crosses back above the 20 level, signaling a potential bullish reversal.
- The RSI with CCI histogram is green, confirming the bullish trend.
- Enter a buy trade at the start of the next candle after both signals align.
- Place a stop loss below the recent swing low, typically 10–15 pips on M5 or 15–25 pips on M15 charts.
- Set take profit at 20–30 pips on M5 or 40–60 pips on M15, or exit when either the oscillator drops back below 20 or the histogram turns red.
Sell Entry Rules
- The IWPR Forex Oscillator crosses back below the 80 level, signaling a potential bearish reversal.
- The RSI with CCI histogram is red, confirming the bearish trend.
- Enter a sell trade at the start of the next candle after both signals align.
- Set a stop loss above the recent swing high, typically 10–15 pips on M5 or 15–25 pips on M15 charts.
- Take profit at 20–30 pips on M5 or 40–60 pips on M15, or exit when the oscillator rises back above 80 or the histogram turns green.
Advantages
- Combines reversal signals with trend confirmation, reducing false entries.
- Suitable for multiple currency pairs with sufficient volatility, including EURUSD, GBPUSD, and USDJPY.
- Allows scalpers to take advantage of both trend continuation and short-term pullbacks.
- Minimal lag from the combination of oscillator and trend histogram improves timing for entries and exits.
Drawbacks
- It may produce false signals in sideways or low-volatility markets where the oscillator fluctuates around 20 or 80 levels.
- The strategy requires active monitoring due to rapid price movements on M5 and M15 charts.
- Large news events can create sudden reversals that invalidate the setup.
Case Study 1: EURUSD M5 Trade
During the London session, the IWPR Oscillator crossed back above 20, signaling a buy opportunity.
The RSI with CCI histogram was green, confirming the bullish trend.
A buy entry at 1.1020 with a 12-pip stop loss moved quickly to 1.1060, capturing 40 pips before the oscillator showed early signs of weakening and the histogram turned red.
Case Study 2: GBPUSD M15 Trade
In the New York session, the IWPR Oscillator crossed back below 80, indicating a sell signal.
The RSI with CCI histogram was red, confirming the bearish momentum.
A short at 1.2450 with a 20-pip stop loss declined to 1.2395, providing a 55-pip gain before the oscillator rose near 80 again, and the histogram showed green bars.
Strategy Tips
- Focus on highly liquid pairs during major trading sessions for optimal results.
- Use higher timeframes, like H1, to identify the primary trend and align scalping trades in that direction.
- Always check for upcoming news releases to avoid sudden volatility spikes.
- Adjust take profit and stop loss levels based on market volatility; higher volatility may allow larger targets.
- Keep a trading journal to monitor which pairs and timeframes give the best results with this strategy.
- Consider partial profit-taking if the trade moves quickly in your favor, then trail the remaining position.
Download Now
Download the “iWPR+.mq4” Metatrader 4 indicator
MT4 Indicator Characteristics
Currency pairs: Any
Platform: Metatrader 4
Type: chart window indicator
Customization options: Variable (iWPR+ period) Width & Style.
Time frames: 1-Minute, 5-Minutes, 15-Minutes, 30-Minutes, 1-Hour, 4-Hours, Daily, Weekly, Monthly
Type: oscillator

