
About the Kaufman Volatility Forex Indicator
The Kaufman Volatility Forex Indicator for Metatrader 4 is designed to help traders gauge market volatility.
It provides a clear view of how active or calm the market is, allowing traders to adapt their strategies based on current conditions.
The indicator is plotted in a separate sub-window below the main chart and displays readings that fluctuate in response to price movement intensity.
High readings indicate periods of strong market activity, while low readings suggest quiet or range-bound conditions.
It is compatible with all MT4 instruments and multiple timeframes, making it a versatile addition to any trader’s toolkit.
Free Download
Download the “kaufman_volatility.mq4” indicator for MT4
Key Features
- Measures and displays market volatility in a separate sub-window
- Helps adapt risk and position sizing based on volatility
- Easy to interpret for both beginners and experienced traders
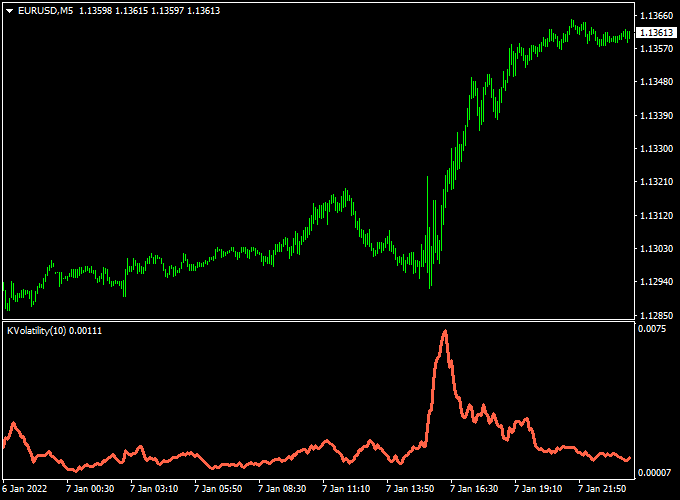
Indicator Chart
The chart shows the Kaufman Volatility Forex Indicator in a sub-window below price.
High spikes indicate strong market movement, while low readings reflect calm or range-bound periods.
Traders can use these readings to time entries, adjust stop loss levels, or identify potential breakout conditions.
Guide to Trade with Kaufman Volatility Forex Indicator
Buy Rules
- Use high volatility periods to confirm breakouts or strong trend moves.
- Combine with a trend-following or entry indicator for confirmation.
- Enter a buy trade when the market is trending and volatility readings are rising.
Sell Rules
- Use high volatility readings to confirm bearish trend moves or breakdowns.
- Combine with entry signals from another indicator for confirmation.
- Enter a sell trade when volatility rises and the trend supports a downward move.
Stop Loss
- Set stops slightly beyond recent swing highs for sell trades or swing lows for buy trades.
- Adjust stop distance based on current volatility readings: wider stops during high volatility and tighter stops during calm periods.
- Dynamic stops using ATR (Average True Range) can also help manage risk efficiently.
Take Profit
- Set initial targets near key support or resistance levels.
- Consider trailing stops during high volatility trends to maximize gains.
- Partial exits can be used when volatility starts to decrease, signaling potential trend slowdown.
Practical Tips
- Use the indicator to filter trades: avoid entering during low volatility unless expecting a breakout.
- Higher timeframes provide more reliable volatility trends; lower timeframes can be used for precise timing.
- Adjust position sizing according to volatility readings to manage risk effectively.
Kaufman Volatility + COG RSI Histogram MT4 Day Trading Strategy
This MT4 day trading strategy uses the Kaufman Volatility indicator to judge market strength and the COG RSI Histogram to provide directional bias.
High readings on the Kaufman indicator suggest strong activity. Low readings suggest quiet or range conditions.
The COG RSI histogram above zero favors buys. The histogram below zero favors sell trades.
The idea is simple. Only take trades when volatility supports the histogram signal.
That way, you filter weak moves and focus on trades with momentum behind them.
The strategy works best on M5 to M30 charts.
Trade during the London and New York sessions for clearer moves.
It suits traders who like disciplined entries and clearly defined risk.
Buy Entry Rules
- Kaufman Volatility is rising or at a high level.
- COG RSI Histogram is above zero and ideally moving higher.
- Enter on the close of the first bullish candle after the histogram crosses or confirms above zero.
- Place a stop loss a few pips below the most recent swing low or use a volatility-based buffer from Kaufman.
- Set initial take profit at 1.5x to 2x the stop distance. Optionally, trail the stop to capture extended moves.
Sell Entry Rules
- Kaufman Volatility is rising or at a high level.
- COG RSI Histogram is below zero and ideally moving lower.
- Enter on the close of the first bearish candle after the histogram crosses or confirms below zero.
- Place a stop loss a few pips above the most recent swing high or use a volatility buffer from Kaufman.
- Set initial take profit at 1.5x to 2x the stop distance. Use a trailing stop when the move extends strongly.
Advantages
- Filters out low-volatility noise and false signals.
- Combines directional momentum with a volatility strength check.
- Easy to read and apply in real time.
- Flexible across major pairs and common intraday frames.
- Works well with a small, defined risk per trade.
Drawbacks
- May miss early breakouts if volatility has not yet expanded.
- Signals can flip quickly in choppy conditions.
- Requires discipline to avoid trading when Kaufman is low.
- Performance depends on session liquidity and spread costs.
Case Study 1 — EURUSD M5 London Open
At the London open, volatility began to rise. Kaufman showed higher readings for several candles.
The COG RSI Histogram crossed above zero and continued upward.
A buy was entered on the next candle close. Stop loss sat below the recent swing low.
The target was 1.8 times the stop size.
The pair ran in a steady leg for the next hour. The trade hit take profit with a clean risk reward.
The volatility filter prevented earlier entries when the histogram briefly touched zero without follow-through.
This trade shows how waiting for volatility and histogram alignment improves odds.
Case Study 2 — GBPUSD M15 Midday Retracement
During the New York midday session, GBPUSD pulled back before dropping. Kaufman readings rose again as the market re-engaged.
The COG RSI Histogram dropped below zero and strengthened.
A short was entered at the close of the confirming bearish candle.
Stop loss was placed above the swing high. The target was 2 times the stop.
The move accelerated, and the trade reached its target after a strong leg down. A trailing stop captured more profit when the trend extended.
This example shows how using Kaufman to allow only active conditions helps capture larger intraday swings.
Strategy Tips
- Only trade when Kaufman shows rising or elevated readings. Ignore signals when Kaufman is flat.
- Wait for the histogram to cross and then confirm with a candle close. Avoid entering on small wicks or spikes.
- Adjust stop sizes per pair volatility. Volatile pairs need wider stops and larger targets.
- Be aware of the spread and commission.
- Use small position sizes while testing. Aim for a consistent edge over many trades.
- Consider partial exits and trailing stops to protect gains during strong moves.
- Backtest across multiple months and sessions to find the best parameter ranges.
Download Now
Download the “kaufman_volatility.mq4” indicator for Metatrader 4
FAQ
How is volatility measured by this indicator?
The indicator calculates market volatility based on price movements and displays it as a fluctuating value in a separate sub-window.
Higher readings indicate stronger activity, while lower readings indicate quieter periods.
Can Kaufman Volatility be used for entry signals?
Yes, it can highlight potential breakout periods or trend continuation moments, but it is best used in combination with other entry indicators.
Can it help manage risk?
Yes, traders can adjust stop loss and position size based on volatility readings to avoid being stopped out prematurely during high market swings.
Summary
The Kaufman Volatility Forex Indicator for MT4 provides a clear and practical way to monitor market activity.
By showing high and low volatility periods, traders can improve trade timing, filter low-probability setups, and adjust risk management accordingly.
Traders can combine it with trend, momentum, or breakout indicators to create a flexible and disciplined trading approach.


