
About the Kumo Cloud Heatmap MTF Forex Indicator
The Kumo Cloud Heatmap MTF Indicator for MT4 combines the Kumo cloud with a multi-timeframe heatmap.
It displays buy and sell trends across multiple charts, allowing traders to quickly spot bullish and bearish conditions.
The indicator shows a colored dashboard directly on the MT4 chart.
Green signals indicate bullish trends, and red signals indicate bearish trends for the selected currency pair and timeframe.
Colors and layouts can be customized in the inputs for personalized display.
This tool is suitable for scalpers on lower timeframes like M1–M15 and intraday traders on M15–H4.
It helps visualize trends across multiple timeframes at a glance, simplifying trade decisions.
Free Download
Download the “kumo_cloud_heatmap_mtf_window_2_2.mq4” indicator for MT4
Key Features
- Multi-timeframe heatmap showing bullish and bearish trends
- Uses Kumo cloud for trend detection
- Supports M1, M5, M15, M30, H1, H4, D1, W1, and MN charts
- Customizable colors and layout for personal preference
- Provides quick trend confirmation for scalping and intraday trades
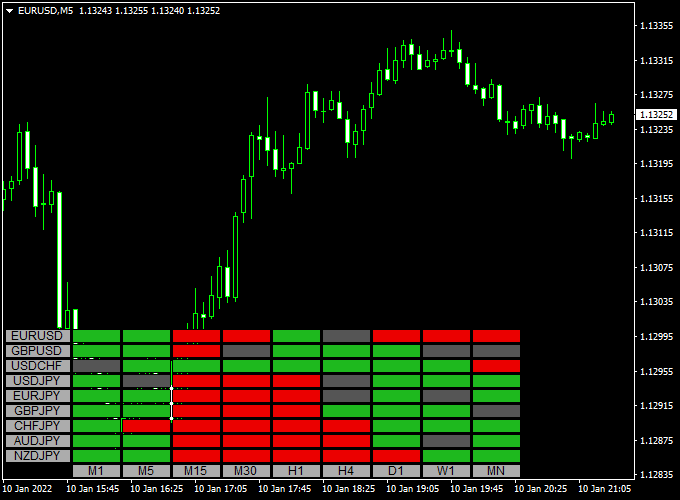
Indicator Chart
The chart shows the Kumo Cloud Heatmap MTF indicator on an MT4 chart.
The dashboard displays green for bullish trends and red for bearish trends across selected timeframes.
Traders can use it to align trades with the dominant trend.
This setup is generally good for scalping on M1–M15 charts and intraday trading on M15–H4 charts.
Guide to Trade with Kumo Cloud Heatmap MTF
Buy Rules
- Enter a buy when the dashboard shows green on your preferred timeframe
- Confirm trend direction on higher timeframes for intraday trades
- Combine with other trend-following indicators for added confidence
Sell Rules
- Enter a sell when the dashboard shows red on your preferred timeframe
- Confirm trend direction on higher timeframes for intraday trades
- Combine with other trend-following indicators for added confidence
Stop Loss
- Place stops below recent swing lows for buys
- Place stops above recent swing highs for sells
Take Profit
- Target the next support or resistance level
- Exit fully if the heatmap changes color, indicating a trend reversal
Practical Tips
- Use lower timeframes (M1–M15) for scalping quick trends
- Use M15–H4 for intraday trades
- Check multiple timeframes to confirm the trend direction
- Customize colors and dashboard layout for easy visualization
MT4 Day Trading Strategy: Kumo Cloud Heatmap + Ashi Trend Signal
This day trading system combines the power of the Kumo Cloud Heatmap Indicator for MT4 and the Ashi Trend Signal Indicator.
The setup offers a simple and effective way to confirm market trends across multiple time frames while timing entries with clear visual arrows.
It’s designed for traders who prefer structured intraday trading on pairs with strong momentum and directional bias.
The Kumo Cloud Heatmap serves as a higher-timeframe trend filter, displaying the overall market sentiment across several time frames and major pairs.
A green heatmap means the trend is bullish, while a red heatmap indicates bearish pressure.
The Ashi Trend Signal then refines these insights with precise buy and sell arrows, offering entry points that align with multi-timeframe strength.
This strategy works well on M15, M30, and H1 charts, particularly during the London and New York sessions when price movement is strongest.
Buy Entry Rules
- Confirm that the Kumo Cloud Heatmap shows mostly green across key timeframes for your chosen pair (M15, M30, H1).
- Wait for a blue arrow from the Ashi Trend Signal to appear on your chart.
- Enter a buy trade at the close of the candle where the blue arrow appears.
- Set a stop loss below the recent swing low or below a key support level.
- Set take profit for 30–45 pips on major pairs or use a trailing stop of 20 pips to follow the trend.
Sell Entry Rules
- Confirm that the Kumo Cloud Heatmap shows red across multiple timeframes, signaling a strong bearish bias.
- Wait for a red arrow from the Ashi Trend Signal to confirm downside momentum.
- Enter a sell trade at the close of that candle.
- Place the stop loss above the most recent swing high or resistance level.
- Set take profit between 30–50 pips or trail your position with a 15–20 pip dynamic stop.
Advantages
- Uses a clear, multi-timeframe heatmap for high-confidence entries.
- Combines strong trend alignment with visual signal precision.
- Flexible take-profit management suitable for volatile markets.
- Effective for intraday traders who prefer structured setups.
- Minimizes false trades by filtering weak or neutral trends.
Drawbacks
- It may produce late entries when the trend accelerates suddenly.
- In ranging markets, mixed heatmap colors can lead to indecision.
- Signals may appear less frequently on higher timeframes.
- Performance depends heavily on session volatility and spread size.
Case Study 1: EUR/USD on M30
During the London session, the Kumo Cloud Heatmap for EUR/USD showed a strong green signal on M15, M30, and H1.
A blue arrow from the Ashi Trend Signal appeared at 1.0985.
A buy entry was made with a 20-pip stop loss and a 40-pip target.
Within three hours, the pair reached 1.1025, closing the trade with a 2× reward-to-risk ratio.
Case Study 2: AUD/JPY on H1
In the Tokyo session, the Kumo Cloud Heatmap displayed red across all short-term timeframes.
The Ashi Trend Signal printed a red arrow at 97.10.
A sell order was placed with a 25-pip stop and a 45-pip target.
As volatility increased, the pair dropped to 96.65, achieving the take profit smoothly within four hours.
Strategy Tips
- Use this system on trending days—avoid choppy or overlapping heatmap readings.
- Combine with key levels or Fibonacci retracements to refine entries.
- For higher accuracy, only trade when at least three consecutive timeframes on the heatmap show the same color.
- Try a partial take profit approach: close half the position at +25 pips and trail the rest.
- Stick to high-volume sessions for stronger and faster market reactions.
The combination of the Kumo Cloud Heatmap and Ashi Trend Signal indicators creates a structured day trading approach based on trend strength and timing precision.
The heatmap’s broad overview keeps traders aligned with the dominant market direction, while the arrow signals pinpoint ideal entry opportunities.
This setup provides a balance between simplicity and depth, making it suitable for both beginners and advanced intraday traders.
Download Now
Download the “kumo_cloud_heatmap_mtf_window_2_2.mq4” indicator for Metatrader 4
FAQ
Which timeframes are best for scalping?
M1–M15 charts are best for scalping, as the heatmap gives quick visual signals of bullish and bearish trends.
Can this indicator be used for longer-term trades?
Yes. For intraday trading or swing trades, M15–H4 charts provide reliable trend signals.
Does it repaint?
No. The heatmap uses completed bar data from the Kumo cloud, so colors remain fixed once plotted.
Is the heatmap customizable?
Yes. You can adjust colors, layouts, and select which timeframes to display in the indicator inputs.
Summary
The Kumo Cloud Heatmap MTF Indicator for MT4 delivers a clear multi-timeframe trend overview using green and red signals for bullish and bearish markets.
It helps traders align trades with the dominant trend across M1 to MN charts.
It is generally good for scalping on lower timeframes and intraday trading on higher M15–H4 charts.
The visual heatmap simplifies decision-making and reduces the need to manually check multiple timeframes.
Customizable colors and layouts allow traders to personalize the dashboard.


