About the Large Time Frame Candlestick Forex Indicator
The Large Time Frame Candlestick Indicator for MT4 allows traders to plot candlesticks from a higher time frame onto a lower time frame chart.
For example, you can display daily candlesticks on a 1-hour or 5-minute chart to see the overall trend clearly.
This provides a visual representation of the bigger picture while trading on smaller time frames.
Traders can adjust the ‘Timeframe’ input in the indicator settings to select which higher time frame candlesticks to display.
By observing the trend from a larger time frame, you can make more informed entries and exits on smaller charts, which is useful for intraday trading and scalping.
Free Download
Download the “LargeTimeFrame.mq4” indicator for MT4
Key Features
- Plots larger time frame candlesticks on smaller charts
- Helps visualize the overall market trend
- Customizable time frame input
- Supports multiple currency pairs
- Works for intraday and M1–M5 scalping
- Easy to set up and beginner-friendly
- Provides context for trade entries and exits
Indicator Chart
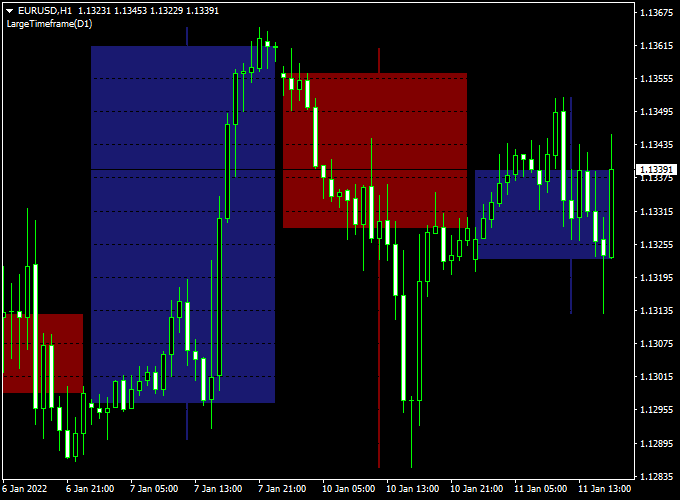
The chart shows the Large Time Frame Candlestick Indicator on MT4.
Daily candlesticks are displayed on a 1-hour chart, showing the general trend.
Traders can use these candlesticks to identify support/resistance levels, trend direction, and potential trade entries.

Guide to Trade with Large Time Frame Candlestick Indicator
Buy Rules
- Enter a buy when the smaller timeframe price aligns with an uptrend seen on the larger candlestick
- Confirm trend direction using moving averages or higher time frame indicators
- Reverse or exit if the smaller timeframe price shows a strong bearish reversal against the larger trend
Sell Rules
- Enter a sell when the smaller timeframe price aligns with a downtrend seen on the larger candlestick
- Confirm trend direction using moving averages or higher time frame indicators
- Reverse or exit if the smaller timeframe price shows a strong bullish reversal against the larger trend
Stop Loss
- Place stops below the swing low of the larger time frame candlestick for buys
- Place stops above the swing high of the larger time frame candlestick for sells
- For M1–M5 scalping, use tighter stops based on recent smaller candle swings
- Adjust stops based on the volatility of the currency pair
Take Profit
- Target the next major level of the larger time frame candlestick
- For scalping, aim for smaller profit targets of 5–15 pips on M1–M5 charts
- Partial exits at intermediate support/resistance can improve risk management
- Exit fully if the smaller timeframe price shows a reversal against the trend
Practical Tips
- Use M1–M5 charts for scalping while observing daily or H4 candlesticks
- M15–H1 charts are best for intraday entries using a larger candlestick context
- Focus on clear alignment between smaller and larger time frame trends
MT4 Day Trading Strategy Using Large Time Frame Candlestick and MACD Signal Bars
This MT4 day trading strategy combines the Large Time Frame Candlestick Forex Indicator MT4 with the MACD Signal Bars Metatrader 4 Forex Indicator to help traders identify strong intraday trends.
The Large Time Frame Candlestick indicator allows you to plot higher timeframe candles on lower timeframe charts.
A blue large candlestick indicates a bullish trend, and a red large candlestick indicates a bearish trend.
The MACD Signal Bars provide precise buy and sell entries with green bars for buys and red bars for sells.
This combination is ideal for M15, M30, and H1 charts for day traders seeking high-probability setups.
Buy Entry Rules
- Confirm the Large Time Frame Candlestick is blue, indicating a bullish trend.
- Wait for the MACD Signal Bars to turn green, signaling a buy.
- Enter a buy trade at the close of the confirming candle.
- Set the stop loss a few pips below the recent swing low.
- Close the trade when a red MACD Signal Bar appears or when the large candlestick changes color to red, signaling a trend reversal.
Sell Entry Rules
- Confirm the Large Time Frame Candlestick is red, indicating a bearish trend.
- Wait for the MACD Signal Bars to turn red, signaling a sell.
- Enter a sell trade at the close of the confirming candle.
- Set the stop loss a few pips above the recent swing high.
- Close the trade when a green MACD Signal Bar appears or when the large candlestick changes color to blue, signaling a trend reversal.
Advantages
- Combines trend confirmation from higher timeframes with precise intraday entries.
- Helps traders stay on the right side of the trend and avoid counter-trend trades.
- Clear exit signals from MACD bars or large candlestick color change.
- Works well for multiple currency pairs and active day trading sessions.
Drawbacks
- Large candlestick color changes may lag in highly volatile conditions.
- Stop loss placement is important to prevent early exits in minor retracements.
Case Study 1 – EUR/USD
On the EUR/USD M30 chart, the daily candlestick plotted on the chart was blue, indicating a bullish trend.
Shortly after, the MACD Signal Bars turned green, triggering a buy entry at 1.1055 with a stop loss at 1.1040.
The trade was closed when a red MACD bar appeared at 1.1080, resulting in a 25-pip gain over a few hours.
This shows how higher timeframe trend confirmation plus precise MACD entries can produce reliable intraday trades.
Case Study 2 – GBP/JPY
On the GBP/JPY H1 chart, the daily large candlestick turned red, signaling a bearish trend.
A red MACD Signal Bar appeared, prompting a sell entry at 178.80 with a stop loss at 179.20.
The trade closed when a green MACD bar appeared at 178.35, achieving a 45 pip profit within the day.
This example demonstrates the effectiveness of combining higher timeframe trends and MACD signal bars for day trading.
Strategy Tips
- Use this strategy during active sessions, such as London and New Yor,k for stronger trend movements.
- Focus on volatile currency pairs for faster and more profitable day trades.
- Always wait for both the large candlestick trend and MACD signal bar confirmation before entering.
- Exit trades promptly when MACD bars or large candlestick colors indicate a potential reversal.
- Consider adjusting stop loss and trailing stop based on recent swing points to protect profits.
Download Now
Download the “LargeTimeFrame.mq4” indicator for Metatrader 4
FAQ
Can this indicator be used for M1–M5 scalping?
Yes. Plotting larger time frame candlesticks on M1–M5 charts helps spot the main trend for fast scalping trades.
Does it repaint?
No. Once plotted, the candlesticks remain fixed and provide a reliable reference for trend analysis.
Which time frames work best?
Daily or H4 candlesticks on M1–M5 or M15 charts give a good overview of the trend. Traders can adjust the ‘Timeframe’ input as needed.
How can I combine it with other indicators?
Combine with moving averages, oscillators, or price action tools to confirm trade direction and improve entry timing.
Summary
The Large Time Frame Candlestick Forex Indicator for MT4 plots higher timeframe candlesticks on smaller charts, helping traders see the overall trend while trading intraday or scalping.
It allows traders to align smaller timeframe entries with the bigger trend, improving trade accuracy and risk management.
Stop loss and take profit levels can be placed based on larger candlestick swings for higher probability trades.
By combining this indicator with other trend or momentum tools, traders can reduce false signals and make faster, smarter trading decisions on both scalping and intraday setups.


