
About the Levelator Forex Signals Indicator
The Levelator Forex Signals Indicator for Metatrader 4 is designed to help traders spot high-probability entry and exit signals by combining trend strength and dynamic price behavior.
Instead of waiting for lagging indicators, Levelator generates signal bars based on real-time market context, making trend and reversal identification far simpler.
This indicator works by evaluating multiple price conditions and internal algorithms to produce colored arrows or bars that suggest potential buy and sell moments.
These signals are not random: they are generated when price momentum aligns with short-term directional intent.
Levelator is ideal for traders who want actionable signals that can be used across multiple timeframes and markets.
Whether you trade EURUSD on H1 or GBPJPY on H4, this indicator simplifies decision-making with a practical blend of trend detection and momentum confirmation.
Free Download
Download the “Levelator.ex4” indicator for MT4
Key Features
- Generates dynamic buy and sell signals
- Integrates price momentum and trend strength
- Works on all MT4 timeframes and currency pairs
- Signals help time entries and exits
- Suitable for intraday and swing trading
Indicator Chart
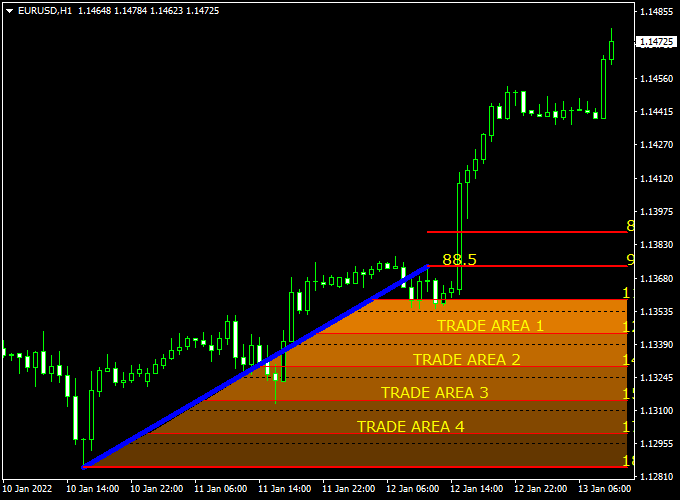
The example chart displays the Levelator Forex Signals Indicator in action on an MT4 price chart.
Buy and sell signals appear as colored areas when specified conditions are met.
Guide to Trade with Levelator Forex Signals Indicator
Buy Rules
- Wait for a buy signal area to appear on the chart
- Confirm the signal aligns with the higher timeframe trend
Sell Rules
- Wait for a sell signal area to appear
- Ensure trend direction supports the sell signal
Stop Loss
- Set stop loss 3 pips below the recent swing low for buy trades
- Set stop loss 3 pips above the recent swing high for sell trades
- Allow sufficient room to avoid false breakouts
Take Profit
- Target the next logical resistance or support level
- Trail stops with market structure shifts
Practical Tips
- Use only signals that align with the dominant timeframe trend
- Ignore signals during consolidation without structure
- Use sessions with good liquidity to reduce whipsaws
- Combine with support/resistance levels for cleaner setups
Levelator + Super Half Trend Intraday Trading Strategy for MT4
The combination of the Levelator Forex Signals Indicator and the Super Half Trend Forex Indicator creates a clear and effective intraday trading strategy for MT4 users.
This system filters out noise and focuses on aligning short-term price action with the dominant intraday trend.
It works best on the M15 and M30 charts, making it suitable for traders who want multiple trade opportunities during the day while maintaining structure and discipline.
The Levelator indicator defines the overall trend direction by dividing the chart into two clear zones.
When price trades inside the orange box, it signals a bullish trend, while movement within the blue box represents a bearish environment.
The Super Half Trend indicator then provides precise entry points with its arrows — blue arrows indicate potential buy signals and red arrows suggest sell opportunities.
The combination ensures that traders only enter trades when both the trend and timing align.
Buy Entry Rules
- Price is trading within the orange Levelator trade box, confirming a bullish trend condition.
- A blue arrow appears on the Super Half Trend indicator, signaling a buy entry opportunity.
- Enter a buy trade at the open of the next candle after the blue arrow confirmation.
- Set a stop loss 20–25 pips below the nearest swing low or below the orange box boundary.
- Take profit at 40–50 pips or when a red arrow appears, indicating a possible reversal.
Sell Entry Rules
- The price is trading inside the blue Levelator trade box, indicating a bearish market structure.
- A red arrow appears on the Super Half Trend indicator, confirming a sell signal.
- Enter a sell position at the open of the next candle after confirmation.
- Place a stop loss 20–25 pips above the most recent swing high or above the blue box area.
- Set take profit around 40–50 pips or when a blue arrow appears as a reversal warning.
Advantages
- Provides visual zones for trend confirmation.
- Simple entry and exit conditions, ideal for intraday traders.
- Minimizes false entries by aligning box zones with arrow signals.
- Works well on most volatile currency pairs like GBP/JPY, EUR/AUD, and USD/CHF.
- Quick trades with defined stop and profit levels help reduce risk exposure.
Drawbacks
- Box boundaries may shift in volatile markets, requiring active monitoring.
- Fewer trades in ranging or low-volatility sessions.
- Sudden market reversals can trigger false exits.
- Performance may vary between currency pairs depending on volatility.
Case Study 1 – GBP/JPY M30 Chart
On a Thursday morning, GBP/JPY traded consistently inside the orange Levelator box, confirming bullish momentum.
Around 192.45, a blue arrow from the Super Half Trend indicator appeared.
A buy trade was opened at 192.50 with a stop loss at 192.20 and a take profit set at 193.00.
The pair rallied strongly through the London session, hitting the target for a 50-pip gain before a red arrow signaled potential exhaustion.
Case Study 2 – EUR/AUD M15 Chart
EUR/AUD moved within the blue Levelator box, suggesting a bearish bias.
A red arrow appeared at 1.6265, confirming the setup.
A sell trade was executed at 1.6260 with a stop loss at 1.6285 and a take profit at 1.6210.
The trade reached the profit target in just under two hours as momentum continued to push lower before a blue arrow hinted at a retracement.
Strategy Tips
- Trade only when both indicators align clearly to avoid mixed signals.
- Stick to major and cross pairs with good daily volatility, such as GBP/JPY, EUR/AUD, and USD/CAD.
- Avoid entering trades during major economic announcements to reduce whipsaws.
- Use trailing stops after reaching 25 pips in profit to secure gains during strong trends.
- Review setups on higher time frames (H1) for extra confirmation before taking larger positions.
This intraday MT4 strategy offers a structured approach to trading the short-term market flow by combining the clarity of the Levelator’s trend zones with the precision of the Super Half Trend’s arrow entries.
It helps traders capture meaningful price movements with defined risk and clear exit levels.
Download Now
Download the “Levelator.ex4” indicator for Metatrader 4
FAQ
How does Levelator determine a signal?
Levelator uses a mix of price momentum and trend evaluation within its internal algorithm.
Signals are generated only when specific conditions favor likely directional movement, helping you avoid random price noise.
Which timeframes work best with this indicator?
While the indicator works on all timeframes, H1 and H4 charts tend to offer more reliable context.
Lower timeframes may produce more frequent signals but require stricter filtering.
Should I trade every signal?
No. Signals are best used with contextual filters such as higher timeframe trend confirmation and nearby support/resistance.
Ignoring weak signals reduces losing trades.
Can the indicator be used for exit signals?
Yes. Many traders use opposite signals or pauses in signal generation to time exits when market momentum shifts or stalls.
Summary
The Levelator Forex Signals Indicator for MT4 gives traders actionable buy and sell signals based on real-time trend and momentum insights.
It simplifies timing by presenting potential entries directly on the price chart.
This indicator is easy to read and works across multiple timeframes and currency pairs.
Used correctly, it helps traders avoid analysis paralysis and focus on practical price action responses.
When combined with market structure tools like swing levels or support/resistance filters, Levelator becomes even more effective.
This pairing boosts confidence in signal validity and improves trade quality over time.


