
About the Levels for Options Traders Indicator
The Levels for Options Traders indicator for Metatrader 4 helps you identify price levels that are useful for options-based and directional trading strategies.
These levels reflect areas where price has shown interest historically, such as zones of support or resistance that tend to influence market behavior.
With this information visible, you can better anticipate key turning points or continuation moves.
The indicator draws clear horizontal lines directly on the main MT4 chart window.
Green lines typically represent support levels where price may find a floor, while red lines highlight resistance where price might struggle to push higher.
These levels give traders immediate reference points, making it easier to plan entries, exits, and key decisions without cluttered analysis.
Whether you trade options or spot Forex, these prominent horizontal levels help you see where price could react.
Free Download
Download the “levels for options.mq4” indicator for MT4
Key Features
- Displays support and resistance levels used by options traders
- Colored horizontal lines (green for support, red for resistance)
- Works on all MT4 timeframes and currency pairs
- Appears directly in the main chart window
- Helps with planning trade entries and exits
Indicator Chart
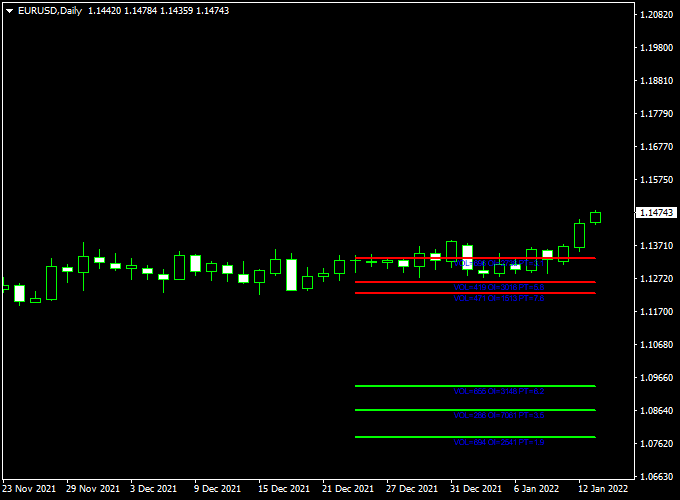
The chart example shows the Levels for Options Traders indicator on an MT4 price chart.
Green horizontal lines mark potential support where price may bounce, and red lines indicate resistance where price might stall or reverse.
Watching price interaction with these levels helps you time entries and exits.
Guide to Trade with Levels for Options Traders Indicator
Buy Rules
- Notice price approaching a green support line on the chart
- Enter a buy trade when price shows a bullish candle close near or above the support
Sell Rules
- Watch for the price nearing a red resistance line
- Enter a sell trade once a bearish candle confirms rejection at that resistance
Stop Loss
- Place a stop loss just below the nearest support line for buy trades
- Place a stop loss just above the nearest resistance line for sell trades
- Allow some room for volatility around major levels
Take Profit
- First target near the next opposite horizontal level
- Extend the take profit toward stronger structural levels on the higher timeframe
- Scale out partial profits as price nears key opposition levels
Practical Tips
- Wait for price confirmation rather than guessing on approach alone
- Use multiple timeframes to verify key levels
Levels for Options Traders + Super Trend Multi-MTF MT4 Intraday Strategy
This intraday MT4 strategy combines the Levels for Options Traders Indicator and the Super Trend Multi-MTF Indicator.
It is designed to help options traders identify breakout opportunities with clear trend confirmation.
The Levels for Options Traders indicator draws key horizontal support and resistance lines, while the Super Trend Multi-MTF indicator shows the overall trend direction across multiple timeframes.
This strategy works best on M15 and M30 charts and is suitable for traders who prefer precise entry points and controlled risk during active market sessions.
The logic behind this strategy is simple. The Levels indicator provides clear reference points where price is likely to react.
The Super Trend Multi-MTF confirms the strength of the trend, allowing traders to enter trades in the direction of momentum.
Combining these two indicators filters out false breakouts and increases the probability of capturing profitable moves.
Buy Entry Rules
- Price is approaching or trading near the green horizontal support line on the Levels for Options Traders indicator.
- The Super Trend Multi-MTF indicator shows a green line on the current timeframe and at least one higher timeframe.
- Enter a buy trade when the price breaks above the nearest red resistance line.
- Set a stop loss just below the green support line or the most recent swing low.
- Set a take profit at a 1:2 risk-to-reward ratio or use a trailing stop to lock in profits.
Sell Entry Rules
- Price is approaching or trading near the red resistance line on the Levels for Options Traders indicator.
- The Super Trend Multi-MTF indicator shows an orange line on the current timeframe and at least one higher timeframe.
- Enter a sell trade when the price breaks below the nearest green support line.
- Place a stop loss just above the red resistance line or the most recent swing high.
- Set a take profit at a 1:2 risk-to-reward ratio or trail the stop to secure profits as the price moves in your favor.
Advantages
- Helps identify high-probability breakout trades with trend confirmation.
- Visual setup makes it easy to spot entry and exit levels quickly.
- Works well on multiple timeframes and currency pairs.
- Reduces false entries by combining trend and level confirmation.
- Defined stop loss and take profit levels improve risk management.
- Suitable for intraday options trading where precise timing is important.
Drawbacks
- Breakouts can occasionally fail, requiring careful monitoring.
- Strategy requires patience to wait for confirmation from both indicators.
- Price may oscillate near support or resistance lines, leading to small stop-outs.
- Effectiveness may vary depending on the currency pair and session activity.
Case Study 1 – GBP/JPY M15 Chart
During the European session, GBP/JPY approached the green support line at 192.50.
The Super Trend Multi-MTF indicator showed a green line on both the M15 and H1 charts.
When the price broke above the red resistance line at 192.80, a buy trade was entered at 192.82 with a stop loss at 192.50 and a take profit at 193.40.
The trade reached the target within three hours, delivering a 58-pip gain before a potential trend reversal occurred.
Case Study 2 – EUR/USD M30 Chart
EUR/USD traded near the red resistance line at 1.0920 during the London session.
The Super Trend Multi-MTF indicator displayed an orange line on both the M30 and H1 charts.
Price broke below the green support line at 1.0895, triggering a sell trade at 1.0893.
The stop loss was set at 1.0925 and the take profit at 1.0835.
The pair moved steadily lower and reached the target within four hours for a 58-pip profit.
Strategy Tips
- Trade during the London and New York sessions for stronger momentum.
- Confirm that both current and higher timeframes agree on the trend direction before entering a trade.
- Use a trailing stop after capturing half of the target profit to secure gains.
- Avoid trading around major economic news that can cause erratic price spikes.
- Focus on volatile pairs such as GBP/JPY, EUR/USD, and AUD/NZD for better breakout opportunities.
This MT4 intraday strategy provides options traders with a structured and reliable approach.
By combining support and resistance levels with multi-timeframe trend confirmation, traders can identify high-probability entries, manage risk effectively, and capture consistent intraday profits.
Download Now
Download the “levels for options.mq4” indicator for Metatrader 4
FAQ
Do the lines change after they are drawn?
Once the levels are plotted based on price history, they remain fixed unless the indicator recalculates new significant levels.
They do not repaint arbitrarily as price moves.
Which timeframes benefit most from this indicator?
The indicator works on all timeframes, but H1 and above tend to offer more reliable reactions to support and resistance levels due to higher liquidity and clearer price structure.
Can I use this indicator with options strategies?
Yes. Levels highlighted by this indicator often coincide with zones that can be used for options pricing or directional bias, giving you relevant points to plan expiries or directional trades.
Is this helpful for range trading?
Yes. In ranging markets, the green and red horizontal levels act as support and resistance boundaries where bounce or rejection opportunities frequently arise.
Summary
The Levels for Options Traders indicator for MT4 shows key horizontal price levels that help you see where support and resistance has been influential.
These levels give you extra context for planning trades and managing risk.
The indicator displays green support lines and red resistance lines directly on the chart, making it straightforward to interpret where price may react.
Used consistently, these levels can improve your entries and exits.


