
About the Linear Regression Slope Forex Indicator
The Linear Regression Slope Forex Indicator for Metatrader 4 is a trend-focused tool that calculates and displays the slope of a linear regression line in a separate MT4 window.
By tracking how the slope moves above or below the 0.00 neutral level, traders can quickly assess trend direction and strength.
A rising slope above 0.00 signals bullish momentum, while a declining slope below 0.00 signals bearish momentum.
This simple visual representation helps traders spot potential trade entries, exits, and trend confirmations without needing complex analysis.
Free Download
Download the “LinearRegSlope_v1.mq4” indicator for MT4
Key Features
- Displays the slope of a linear regression line in a separate MT4 window
- Signals trend direction by crossing above or below the 0.00 level
- Helps identify buy and sell opportunities
- Simple and easy-to-read indicator for both beginners and experienced traders
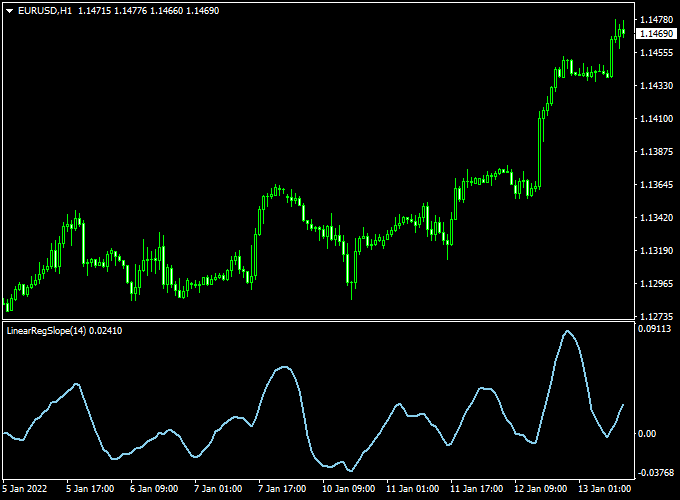
Indicator Chart
The chart example shows the Linear Regression Slope indicator applied in a separate MT4 window.
A cross above 0.00 indicates a potential buy signal, while a cross below 0.00 indicates a potential sell signal.
Observing slope changes alongside market trends can improve trade timing.
Guide to Trade with Linear Regression Slope Forex Indicator
Buy Rules
- Enter a buy trade when the indicator crosses back above the 0.00 neutral level
- Confirm trend alignment using higher timeframe analysis or other indicators
- Use support zones to refine entry points
Sell Rules
- Enter a sell trade when the indicator crosses back below the 0.00 neutral level
- Confirm trend alignment using higher timeframe analysis or other indicators
- Use resistance zones to refine entry points
Stop Loss
- Place stop loss beyond the nearest swing low for buy trades
- Place stop loss beyond the nearest swing high for sell trades
- Adjust stops according to volatility and market structure
Take Profit
- Target previous support/resistance levels or swing highs/lows
- Consider partial exits when the slope begins flattening
- Let trades run if the slope continues strongly in your favor
Practical Tips
- Use a higher timeframe slope direction to filter lower timeframe signals
- Avoid trading when the slope oscillates near 0.00 without clear direction
- Combine with other trend or momentum indicators for confirmation
- Observe slope changes at key price levels for potential reversals
MT4 Scalping Strategy Using Linear Regression Slope and Winner Trend Forex Bars Indicators
This MT4 scalping strategy combines the momentum signals of the Linear Regression Slope Forex Indicator with the trend-confirming signals of the Winner Trend Forex Bars Indicator.
Designed for short-term scalping, the strategy works best on 1-minute to 5-minute charts.
It identifies quick trade opportunities by confirming the momentum direction with trend strength.
The Linear Regression Slope indicator generates a buy signal when the slope moves back above zero and a sell signal when it moves back below zero.
The Winner Trend Forex Bars indicate bullish trends with green histogram bars and bearish trends with red histogram bars.
The take profit targets are set between 5–16 pips for fast scalping.
Buy Entry Rules
- Wait for the Linear Regression Slope to move back above zero, signaling a buy opportunity.
- Confirm the trend with green histogram bars on the Winner Trend Forex Bars indicator.
- Enter a buy trade at the market price once both conditions are met.
- Set a stop loss below the recent swing low.
- Set a take profit for 5–16 pips or near the next resistance level.
Sell Entry Rules
- Wait for the Linear Regression Slope to move back below zero, signaling a sell opportunity.
- Confirm the trend with red histogram bars on the Winner Trend Forex Bars indicator.
- Enter a sell trade at the market price once both conditions are met.
- Set a stop loss above the recent swing high.
- Set a take profit for 5–16 pips or near the next support level.
Advantages
- Combines momentum and trend confirmation for higher accuracy.
- Works effectively on very short timeframes, ideal for scalping.
- Visual histogram and slope signals are easy to interpret.
- Suitable for various currency pairs, including EUR/JPY, EUR/USD, USD/CAD, and NZD/USD.
Drawbacks
- Signals may lag slightly during very fast market movements, leading to delayed entries.
- Frequent trading can be mentally demanding and require high concentration.
- Scalping profits are small, so multiple successful trades are needed to accumulate gains.
- High-frequency trading can increase exposure to slippage and spreads, especially during volatile sessions.
- The strategy may produce false signals during low liquidity periods or when the market is consolidating.
Case Study 1: AUD/JPY on 1-Minute Chart
On the AUD/JPY 1-minute chart, the Linear Regression Slope moved back above zero, signaling a buy entry.
The Winner Trend Forex Bars displayed green histogram bars, confirming the bullish trend.
The trade was entered at 89.50, with a stop loss at 89.45 and a take profit at 89.60, achieving a 10-pip gain in 5 minutes.
Case Study 2: USD/CAD on 5-Minute Chart
On the USD/CAD 5-minute chart, the Linear Regression Slope moved back below zero, signaling a sell entry.
The Winner Trend Forex Bars showed red histogram bars, confirming the bearish trend.
The trade was entered at 1.3500, with a stop loss at 1.3510 and a take profit at 1.3490, netting 10 pips in 8 minutes.
Strategy Tips
- Always wait for both momentum and trend confirmation before entering trades.
- Use recent swing highs and lows to set stop loss and take profit levels accurately.
- Adjust take profit targets between 5–16 pips depending on market volatility.
Download Now
Download the “LinearRegSlope_v1.mq4” indicator for Metatrader 4
FAQ
What does the 0.00 level represent?
The 0.00 level acts as a neutral reference. Crosses above indicate bullish momentum, while crosses below indicate bearish momentum.
Can this indicator be used on all timeframes?
Yes. The indicator works on any MT4 timeframe, though higher timeframes often provide clearer trend signals with fewer false movements.
Is this suitable for short-term trading?
Yes. It can be used for intraday scalping or short-term trades, especially when confirming trends or momentum shifts.
Does the indicator repaint?
No. Once the slope value crosses the 0.00 level, the signal remains fixed. Future slope changes will produce new signals without altering past ones.
Summary
The Linear Regression Slope Forex Indicator for MT4 is a straightforward tool to monitor trend direction and momentum using slope analysis.
By tracking how the slope moves relative to the 0.00 level, traders can identify potential buy and sell opportunities efficiently.
It works on all timeframes and symbols and can be used alone or alongside other technical indicators to confirm trade direction.
Its simplicity makes it suitable for both new and experienced traders.


