
About the MA Angle Forex Indicator
The MA Angle Forex Indicator for MT4 is a powerful tool designed for traders who want to follow the short-term trend and capture precise entry points.
The indicator displays a yellow line oscillating above and below the 0.00 neutral level in a separate chart window, making it easy to identify momentum shifts in the market.
It is ideal for scalpers and day traders who seek accurate signals without waiting for long-term trend confirmations.
By tracking the angle of the moving average, this indicator provides clear indications of trend strength and potential reversals.
Traders can use it to quickly spot when the market is gaining or losing momentum, allowing for faster decision-making and potentially higher win rates.
Combined with other indicators, the MA Angle can be part of a robust trading strategy for consistent results.
Free Download
Download the “ma angle.mq4” indicator for MT4
Key Features
- Oscillates above and below the 0.00 level to show short-term trend direction
- Generates clear buy and sell signals for scalping and day trading
- Works in any timeframe, making it versatile for multiple trading styles
- Easy-to-read line visualization for quick decision-making
- Compatible with other MT4 indicators for strategy combinations
- Free and lightweight, requiring minimal chart space
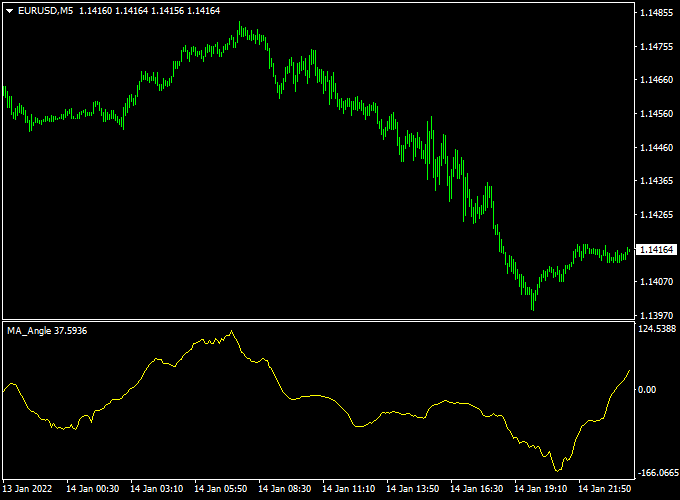
Indicator Chart
The MA Angle chart shows the yellow line oscillating above and below the 0.00 neutral level.
When the line crosses above 0.00, it indicates a buy opportunity; when it crosses below, it signals a potential sell.
Guide to Trade with the MA Angle Forex Indicator
Buy Rules
- Enter a buy trade when the yellow line crosses back above 0.00.
- Use a short-term support level to strengthen your entry decision.
Sell Rules
- Enter a sell trade when the yellow line crosses back below 0.00.
- Consider nearby resistance levels before opening the trade.
Stop Loss
- Place a stop loss below the recent swing low for buys.
- Place a stop loss above the recent swing high for sells.
Take Profit
- Set take profit targets based on recent market swings or support/resistance levels.
- Consider closing partial positions when the yellow line starts flattening near the neutral level.
- Use trailing stops to lock in profits during strong trends, adjusting dynamically as the price moves.
Practical Tips
- Focus on high-volume currency pairs for scalping signals.
- Monitor multiple timeframes to avoid false signals in choppy markets.
- Adjust sensitivity based on your trading style and preferred timeframe.
MA Angle & DDFX Major Trend MT4 Intraday Strategy
This intraday forex strategy combines the MA Angle Forex Indicator and the DDFX Major Trend Indicator to capture short-term trend movements.
The MA Angle indicator signals a buy when the yellow line is above the zero level and a sell when below.
The DDFX Major Trend Indicator confirms the trend with a blue histogram for bullish momentum and a red histogram for bearish momentum.
This strategy works well on 5-minute and 15-minute charts for major currency pairs like EUR/USD, GBP/USD, and USD/JPY.
Buy Entry Rules
- Ensure the DDFX Major Trend histogram is blue, indicating a bullish trend.
- Wait for the MA Angle yellow line to move above the zero level.
- Enter a buy trade at the opening of the next candle after confirmation.
- Place a stop loss below the most recent swing low.
- Set a take profit target of 10–20 pips, depending on intraday volatility.
- Close the trade immediately if the MA Angle line moves below zero or the DDFX histogram turns red.
Sell Entry Rules
- Ensure the DDFX Major Trend histogram is red, indicating a bearish trend.
- Wait for the MA Angle yellow line to move below the zero level.
- Enter a sell trade at the opening of the next candle after confirmation.
- Place a stop loss above the most recent swing high.
- Set a take profit target of 10–20 pips, depending on intraday volatility.
- Close the trade immediately if the MA Angle line moves above zero or the DDFX histogram turns blue.
Advantages
- Combines trend confirmation and momentum for higher probability trades.
- Clear visual signals make entry and exit decisions easy.
- Works effectively on 5-minute and 15-minute intraday charts.
- Applicable to multiple major currency pairs.
- Helps capture short-term intraday price swings efficiently.
Drawbacks
- Requires monitoring during the trading session for optimal entries.
- False signals can occur in sideways or low-volatility markets.
- Take profit targets may not always be reached in flat market conditions.
Case Study 1: EUR/USD 5-Minute Chart
The DDFX histogram was blue, confirming a bullish trend. The MA Angle yellow line moved above zero.
A buy trade was entered at the next candle with a stop loss below the recent swing low and a take profit set at 15 pips.
The trade reached the target, and the position was closed when the yellow line dropped below zero.
Case Study 2: GBP/USD 15-Minute Chart
The DDFX histogram was red, confirming a bearish trend.
The MA Angle yellow line moved below zero.
A sell trade was entered at the next candle with a stop loss above the recent swing high and take profit set at 20 pips.
The trade reached the target, and the position was closed when the histogram turned blue.
Strategy Tips
- Use during high liquidity sessions for tighter spreads and better execution.
- Adjust lot sizes according to account balance and risk tolerance.
- Exit trades immediately if the MA Angle or DDFX histogram changes direction to protect profits.
- Focus on active major currency pairs like EUR/USD, GBP/USD, and USD/JPY.
- Test on a demo account first to familiarize yourself with signal timing.
Download Now
Download the “ma angle.mq4” indicator for Metatrader 4
FAQ
Can the MA Angle be used on all timeframes?
Yes, MA Angle works across all MT4 timeframes, but it is most effective for short-term trading like scalping and day trading.
Does the indicator repaint signals?
No, the MA Angle indicator generates signals based on confirmed line crossings and does not repaint past signals, ensuring reliable entries.
Is there a recommended currency pair for this indicator?
High-liquidity pairs like EUR/USD, GBP/USD, and USD/JPY tend to provide the clearest signals. However, it can be applied to most Forex pairs.
Summary
The MA Angle Forex Indicator is an effective MT4 tool for scalpers and day traders seeking reliable short-term trend signals.
Its clear line crossings above and below the 0.00 level allow traders to spot buy and sell opportunities quickly.
With proper risk management, practical stop loss and take profit settings, this indicator can enhance your trading performance while remaining simple and lightweight for daily use.


