
About the MA Candles Forex Trend Indicator
The MA Candles Forex Trend Indicator for MT4 helps traders follow the most profitable currency trends using colored candlesticks.
The indicator appears in the main MT4 chart as blue and red candles, providing an instant visual representation of market direction.
It works on any timeframe, making it suitable for scalpers, day traders, and swing traders alike.
Blue candles indicate bullish momentum, signaling buy opportunities, while red candles show bearish momentum, signaling sell opportunities.
This indicator simplifies trend trading by removing noise and clearly highlighting when a currency pair is trending.
Combined with other indicators, MA Candles can enhance entry timing and improve overall trading performance.
Free Download
Download the “MA Candles.mq4” indicator for MT4
Key Features
- Displays trend direction using blue and red colored candlesticks
- Generates simple buy and sell signals for any timeframe
- Suitable for scalping, day trading, and swing trading
- Easy to interpret and visually intuitive
- Works alongside other MT4 indicators for strategy combinations
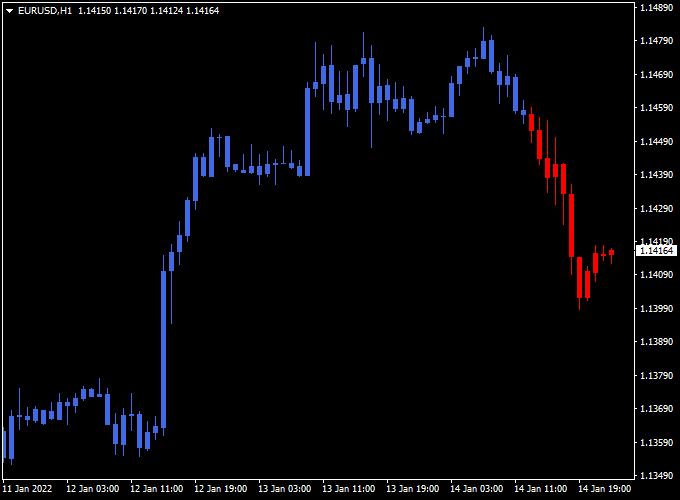
Indicator Chart
The MA Candles chart shows blue and red candlesticks representing bullish and bearish trends.
Blue candles indicate buy signals, while red candles indicate sell signals.
This allows traders to quickly identify trend direction and open trades according to market momentum.
Guide to Trade with MA Candles Forex Trend Indicator
Buy Rules
- Enter a buy trade when a blue candlestick appears.
- Confirm with additional trend indicators for stronger validation.
- Check recent support levels to enhance trade accuracy.
Sell Rules
- Enter a sell trade when a red candlestick appears.
- Confirm with other momentum indicators to avoid false signals.
- Check nearby resistance levels before opening the trade.
Stop Loss
- For buys, place a stop loss below the recent support low.
- For sells, place a stop loss above the recent resistance high.
Take Profit
- Set take profit targets at the next key support/resistance level.
- Partially close positions when the trend slows or candlestick color changes.
- Use trailing stops to capture extended trends and lock in profits dynamically.
Practical Tips
- Focus on high-liquidity pairs for the clearest signals.
- Monitor multiple timeframes to avoid trading during low-volume or sideways markets.
- Adjust trade sensitivity based on your preferred timeframe and style.
MA Candles & Bollinger Bands MACD Indicator Forex Swing Strategy
This swing trading strategy combines the MA Candles Forex Trend Indicator and the Bollinger Bands MACD Signals Indicator to capture medium-term intraday trends.
Blue candles from the MA Candles indicator signal bullish moves, and red candles indicate bearish moves.
The Bollinger Bands MACD histogram confirms momentum with green for buy trends and violet for sell trends.
This strategy works best on M15 and H1 charts for pairs like EUR/USD, GBP/USD, USD/JPY, and AUD/USD.
Buy Entry Rules
- The MA Candles indicator shows blue candles indicating a bullish trend.
- Bollinger Bands MACD histogram is green, confirming bullish momentum.
- Enter a buy trade at the opening of the next candle after both conditions align.
- Place a stop loss below the most recent swing low.
- Set take profit at 15–30 pips or use a trailing stop.
- Close the trade immediately if the MA Candles indicator turns red or the histogram turns violet.
Sell Entry Rules
- The MA Candles indicator shows red candles indicating a bearish trend.
- Bollinger Bands MACD histogram is violet, confirming bearish momentum.
- Enter a sell trade at the opening of the next candle after both conditions align.
- Place a stop loss above the most recent swing high.
- Set take profit at 15–30 pips or use a trailing stop.
- Close the trade immediately if the MA Candles indicator turns blue or the histogram turns green.
Advantages
- Clear trend confirmation with MA Candles and momentum validation via the Bollinger Bands MACD indicator.
- Adaptable for both M15 and H1 charts.
- Helps identify swing trades within intraday trends.
- Suitable for major currency pairs with strong trend moves.
Drawbacks
- Indicators may lag during rapid market reversals.
- False signals can appear in sideways or low-volatility markets.
- Requires active monitoring for timely exits.
Case Study 1: EUR/USD M15 Chart
The MA Candles indicator showed blue candles, and the Bollinger Bands MACD histogram turned green.
A buy trade was entered at the next candle with a stop loss below the recent swing low and a take profit set at 20 pips.
The trade reached the target, and the position was closed when the histogram turned violet.
Case Study 2: GBP/USD H1 Chart
The MA Candles indicator showed red candles, and the Bollinger Bands MACD histogram turned violet.
A sell trade was entered at the next candle with a stop loss above the recent swing high and a take profit set at 25 pips.
The trade reached the target, and the position was closed when the candles turned blue.
Strategy Tips
- Combine entries with key support and resistance levels for higher accuracy.
- Adjust lot sizes based on account balance and risk tolerance.
- Exit trades immediately if the MA Candles or Bollinger Bands MACD histogram changes direction.
- Test the strategy on a demo account before live trading to familiarize yourself with signals.
Download Now
Download the “MA Candles.mq4” indicator for Metatrader 4
FAQ
Can the MA Candles indicator be used on all timeframes?
Yes, it works across all MT4 timeframes, but it is most effective for short-term and medium-term trading where trend momentum is easier to track.
Can I combine MA Candles with other indicators?
Yes, it works well with trend-following indicators to filter false signals and improve entry timing.
Which currency pairs are best for MA Candles?
High-liquidity pairs like EUR/USD, GBP/USD, and USD/JPY provide the most reliable signals, though they can be used on most Forex pairs.
Summary
The MA Candles Forex Trend Indicator is a practical MT4 tool for traders who want clear, reliable trend signals.
Its colored candlesticks instantly highlight bullish and bearish trends, making it easier to spot profitable trading opportunities.
With straightforward buy and sell signals, dynamic take profit and stop loss management, and compatibility with multiple timeframes, MA Candles can help traders make faster, more confident decisions while navigating Forex markets efficiently.


