
About the MA Parabolic Forex Indicator
The MA Parabolic Forex indicator for MT4 combines a moving average with the Parabolic SAR to provide clear buy and sell signals.
It simplifies trend spotting by signaling potential entries directly on the chart.
A buy signal occurs when the candlestick closes above both the moving average and the Parabolic SAR level.
A sell signal occurs when the candle closes below both lines.
This dual-indicator approach helps traders avoid false signals and follow stronger trends.
MA Parabolic is flexible, making it suitable for any trading style, from beginners to experienced traders.
Free Download
Download the “Ma_Parabolic_st2.2-1.ex4” indicator for MT4
Key Features
- Combines moving average and Parabolic SAR signals
- Automatic buy and sell notifications on the chart
- Works across multiple currency pairs and timeframes
- Helps filter out false trend signals
- Easy to follow with simple entry rules
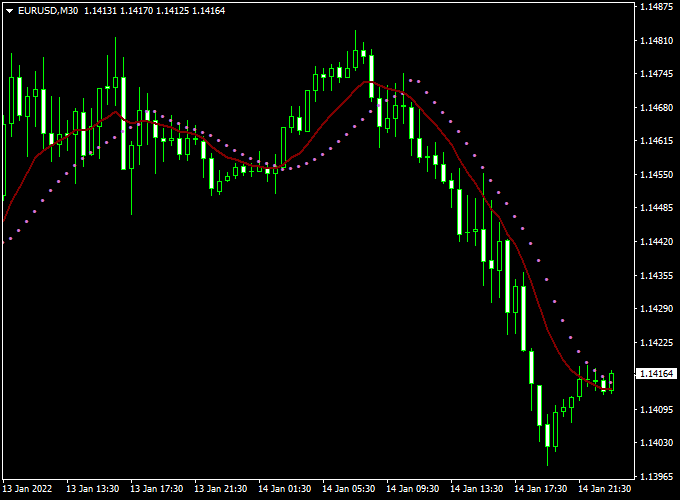
Indicator Chart
The MA Parabolic Forex chart shows the main price action with the moving average and PSAR dots.
When the candlestick closes above both, a buy trade is signaled.
When the candle closes below both, a sell trade is indicated.
Guide to Trade with the MA Parabolic Forex Indicator
Buy Rules
- Wait for the candle to close above the moving average and PSAR
- Enter a buy trade at the close of the signal candle
Sell Rules
- Wait for the candle to close below the moving average and PSAR
- Enter a sell trade at the close of the signal candle
Stop Loss
- Set below the recent swing low for buys
- Set above the recent swing high for sells
- Move the stop to breakeven after partial profit is secured
- Widen stops slightly during volatile sessions or news releases
Take Profit
- Close part of the trade when the PSAR dot flips to the opposite side
- Let the rest run toward the next swing high for buys or swing low for sells
Practical Tips
- Check the higher timeframe trend before taking trades for confirmation
- Combine with volume or momentum filters for stronger signals
MA Parabolic + Supply and Demand Intraday Strategy for MT4
This strategy combines the MA Parabolic Forex Indicator for MT4 with the Supply and Demand Metatrader 4 Forex Indicator to create a precise intraday trading method.
The MA Parabolic indicator generates a buy signal when the candlestick closes above both parabolic moving average lines and a sell signal when it closes below them.
The Supply and Demand indicator highlights key support and resistance zones with green horizontal blocks for demand and red blocks for supply.
Combining trend confirmation with key price levels increases the probability of successful intraday trades.
Why this strategy works
The strategy works by combining a trend-following indicator with key market zones.
The MA Parabolic confirms the direction of the trend while the Supply and Demand zones indicate areas where price may reverse or continue.
This allows traders to enter in the direction of the trend while avoiding low-probability areas.
Buy Entry Rules
- Wait for the candlestick to close above both MA Parabolic lines, indicating a buy signal.
- Confirm that the price is above a green demand zone or approaching it without breaking it.
- Enter a buy trade at the open of the next candle after both conditions are met.
- Place the stop loss below the nearest demand zone or swing low.
- Set a take profit near the next red supply zone or according to a risk-reward ratio of 1:2.
- Exit the trade early if the candlestick closes below both MA Parabolic lines or if the price hits a strong resistance zone.
Sell Entry Rules
- Wait for the candlestick to close below both MA Parabolic lines, indicating a sell signal.
- Confirm that the price is below a red supply zone or approaching it without breaking it.
- Enter a sell trade at the open of the next candle after both conditions are met.
- Place the stop loss above the nearest supply zone or swing high.
- Set a take profit near the next green demand zone or according to a risk-reward ratio of 1:2.
- Exit the trade early if the candlestick closes above both MA Parabolic lines or if the price hits a strong support zone.
Advantages
- Combines trend direction with key supply and demand levels for precise entries.
- Helps filter false signals during volatile intraday moves.
- Works across multiple timeframes and currency pairs.
- Provides a structured approach to intraday trading with controlled risk.
Drawbacks
- Requires monitoring both indicators to ensure accurate entries.
- Price may occasionally break supply or demand zones, resulting in early exits.
- Short-term trades may be affected by sudden news events or spikes in volatility.
Case Study 1 – EUR/USD M15
During the London session, EUR/USD closed a candlestick above both MA Parabolic lines while the price was above a green demand zone at 1.0850.
A buy trade was entered at 1.0852 with a stop loss at 1.0840 and a take profit near the next supply zone at 1.0875.
The trade followed the trend and reached the target within 45 minutes, producing a 23-pip gain.
Case Study 2 – GBP/JPY M15
During the New York session, GBP/JPY closed below both MA Parabolic lines while the price was approaching a red supply zone at 173.50.
A sell trade was entered at 173.48 with a stop loss at 173.65 and a take profit near the next demand zone at 172.90.
The trade hit the target in 60 minutes, yielding a 58-pip gain.
Strategy Tips
- Use M15 or M30 charts for intraday signals.
- Focus on liquid pairs like EUR/USD, GBP/USD, USD/JPY, and GBP/JPY.
- Avoid trading during major news releases to prevent sudden reversals.
- Adjust stop loss and take profit according to volatility and session behavior.
- Combine with other support/resistance levels to improve entry and exit precision.
Download Now
Download the “Ma_Parabolic_st2.2-1.ex4” indicator for Metatrader 4
FAQ
Can I adjust the moving average and PSAR settings?
Yes. You can customize the moving average period and PSAR step/maximum settings to suit your trading style and timeframe.
What if a candle closes above one indicator but not the other?
A signal only triggers when the candlestick closes above both for a buy, or below both for a sell.
Partial alignment is ignored to reduce false entries.
Is the indicator suitable for all trading styles?
Yes. It works for scalping, intraday, or swing trading depending on the timeframe chosen.
Lower timeframes give faster signals, while higher timeframes produce more reliable trends.
How does it handle volatile markets?
During high volatility, signals may appear more frequently.
It’s recommended to use wider stops or check a higher timeframe trend before entering trades in these conditions.
Summary
The MA Parabolic Forex MT4 indicator provides clear buy and sell signals by combining a moving average with the Parabolic SAR.
This dual approach helps traders identify strong trends and avoid false entries.
It is flexible for multiple currency pairs and timeframes, and can be used for scalping, intraday, or swing trades.
With proper risk management and trend confirmation, it serves as both a standalone system and a support tool for more complex strategies.
MA Parabolic is beginner-friendly but also powerful enough for experienced traders.


