
About the Mac Fibonacci Forex Signal Indicator
The Mac Fibonacci Forex Signal indicator for MT4 provides clear buy and sell signals directly on the main chart.
It combines Fibonacci-based calculations with trend analysis to help traders enter and exit positions with precision.
A blue line signals a potential buy, while a red line indicates a potential sell.
The indicator can be used as a standalone system for entries and exits, or as a filter to confirm other strategies.
Its visual signals reduce guesswork, letting traders focus on executing trades efficiently.
Free Download
Download the “Mac fibo.mq4” indicator for MT4
Key Features
- Displays buy and sell signals directly on the main MT4 chart
- Blue line indicates a buy trend, red line indicates a sell trend
- Fibonacci-based calculations enhance trend precision
- Helps identify entries and exits quickly and efficiently
Indicator Chart
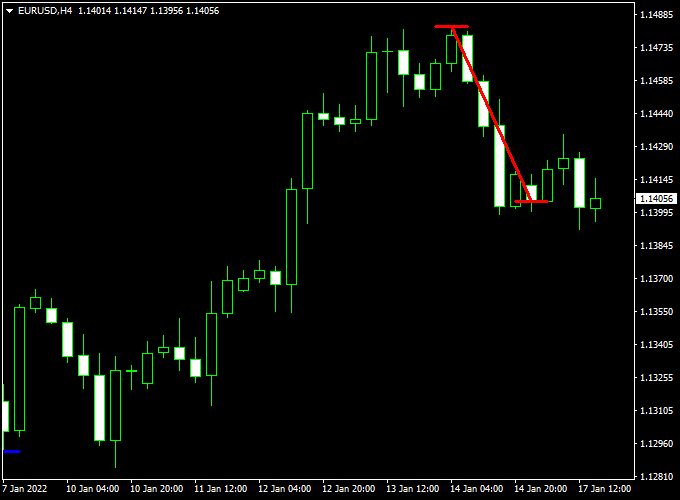
The Mac Fibonacci Forex Signal chart shows price action with colored lines for trading signals.
Blue lines indicate upward moves, while red lines indicate downward moves.
This visualization allows traders to quickly spot trend direction and potential trade opportunities.
Guide to Trade with Mac Fibonacci Forex Signal Indicator
Buy Rules
- Enter a buy trade when the blue line appears
- Confirm the trend is moving upward in the short-term
- Wait for the candle to close above the line for confirmation
Sell Rules
- Enter a sell trade when the red line appears
- Confirm the trend is moving downward
- Wait for the candle to close below the line for confirmation
Stop Loss
- Place below the nearest minor swing low for buys
- Place above the nearest minor swing high for sells
- Adjust slightly if the market is volatile
- Consider using Fibonacci retracement levels for dynamic stop placement
Take Profit
- Set partial profits near the next Fibonacci level in the trend direction
- Let the remaining position run until the opposite signal appears
- Use a trailing stop based on recent swing highs or lows
- Adjust targets depending on momentum and market structure
Practical Tips
- Combine with trend strength indicators for higher accuracy
- Monitor recent swing points to avoid entering during low momentum
- Use multiple timeframes to confirm trend direction before entering
- Avoid taking signals during sharp market spikes or immediately after news events
MAC Fibonacci + Smoothed HMA Forex Scalping Strategy
This scalping strategy combines the MAC Fibonacci Forex Signal Indicator for MT4 with the Smoothed Hull Moving Average (HMA) for MT4.
The MAC Fibonacci indicator shows a blue line for buy signals and a red line for sell signals.
The Smoothed HMA uses green histogram bars to indicate a bullish trend and orange bars for a bearish trend.
Combining these two indicators allows scalpers to enter trades in the direction of the trend with precise entry points for short-term gains.
Why this strategy works
This strategy works by confirming trend direction with the Smoothed HMA while the MAC Fibonacci provides entry signals.
Aligning both indicators ensures that trades are taken with momentum and trend strength, increasing the probability of profitable scalping trades in fast-moving intraday markets.
Buy Entry Rules
- Wait for the MAC Fibonacci blue line to appear, signaling a buy.
- Confirm that the Smoothed HMA histogram shows green bars, indicating a bullish trend.
- Enter a buy trade at the open of the next candle after both conditions are met.
- Place the stop loss below the most recent swing low or below the HMA histogram support.
- Set the take profit between 5–15 pips depending on volatility.
- Exit early if the MAC Fibonacci turns red or the HMA histogram turns orange.
Sell Entry Rules
- Wait for the MAC Fibonacci red line to appear, signaling a sell.
- Confirm that the Smoothed HMA histogram shows orange bars, indicating a bearish trend.
- Enter a sell trade at the open of the next candle after both conditions are met.
- Place the stop loss above the most recent swing high or above the HMA histogram resistance.
- Set the take profit between 5–15 pips depending on volatility.
- Exit early if the MAC Fibonacci turns blue or the HMA histogram turns green.
Advantages
- Combines trend confirmation with precise entry signals for scalping.
- Visual cues make it easy to monitor trades quickly.
- Works well on fast-moving currency pairs and intraday charts.
- Helps reduce false signals by requiring trend alignment.
- Provides clear stop loss and take profit guidelines.
Drawbacks
- Performance may vary depending on the currency pair and market session.
- Spread and broker execution speed can impact small pip targets.
Case Study 1 – NZD/USD M5
During the Asian session, NZD/USD showed a blue line on the MAC Fibonacci indicator while the Smoothed HMA histogram displayed green bars.
A buy trade was entered at 0.6185 with a stop loss at 0.6175 and a take profit at 0.6195.
The trade reached the target in 10 minutes for a 10-pip gain, showing effective alignment of trend and entry signal.
Case Study 2 – USD/CAD M5
During the London session, USD/CAD showed a red line on the MAC Fibonacci while the HMA histogram displayed orange bars.
A sell trade was entered at 1.3475 with a stop loss at 1.3485 and a take profit at 1.3465.
The trade reached the take profit in 12 minutes for a 10-pip gain.
Using both indicators together avoided countertrend entries and captured the momentum move.
Strategy Tips
- Use M5 or M15 charts for scalping opportunities.
- Focus on liquid pairs such as NZD/USD, USD/CAD, EUR/USD, and GBP/USD.
- Adjust stop loss and take profit levels according to current market volatility.
- Strictly follow both indicators for entries to maintain discipline and accuracy.
- Combine with support and resistance levels to enhance trade precision if needed.
Download Now
Download the “Mac fibo.mq4” indicator for Metatrader 4
FAQ
Can the indicator be customized?
Yes. You can adjust the line colors, signal sensitivity, and other settings to suit your trading style.
How do I filter false signals?
Check higher timeframe trends or price structure. Avoid taking trades when the market is consolidating.
Can it be used for long-term trading?
Yes. While suitable for scalping and intraday trades, it can also identify entry points in swing trading when confirmed by larger timeframe trends.
Summary
The Mac Fibonacci Forex Signal MT4 indicator delivers precise buy and sell signals using Fibonacci-based trend calculations.
Blue and red lines provide clear, actionable trade opportunities while reducing uncertainty in decision-making.
Its flexibility allows it to serve as a standalone system or as a trend confirmation tool for other strategies.
With careful stop loss placement and smart take profit management, traders can use it effectively across multiple currency pairs and trading styles.
The indicator’s visual simplicity, combined with Fibonacci logic, makes it a powerful tool for traders looking for clear trend signals and reliable entry points.


