About the MACD and Volume Forex Indicator
The MACD and Volume Forex indicator for MT4 combines trend momentum with volume analysis to provide actionable buy and sell signals.
It uses gray histogram bars along with three signal lines to highlight trend direction and potential trade entries.
A buy trade is indicated when the histogram bars are above the 0.00 level and the red signal line crosses above the blue line.
A sell trade occurs when the histogram bars are below 0.00 and the red signal line crosses below the blue line.
This dual confirmation approach helps traders filter weak signals and focus on stronger trends.
The indicator also plots volume directly on the chart, giving insight into market participation and helping traders gauge trend strength.
It is suitable for scalping, intraday, and swing trading, and can be used standalone or alongside other strategies for confirmation.
Free Download
Download the “macd and volumes.mq4” indicator for MT4
Key Features
- Gray histogram bars show trend alignment relative to the 0.00 level
- Three signal lines for precise buy and sell signals
- Volume plotted on the chart to assess momentum strength
- Non-repainting signals for reliable historical analysis
- Flexible for standalone use or strategy confirmation
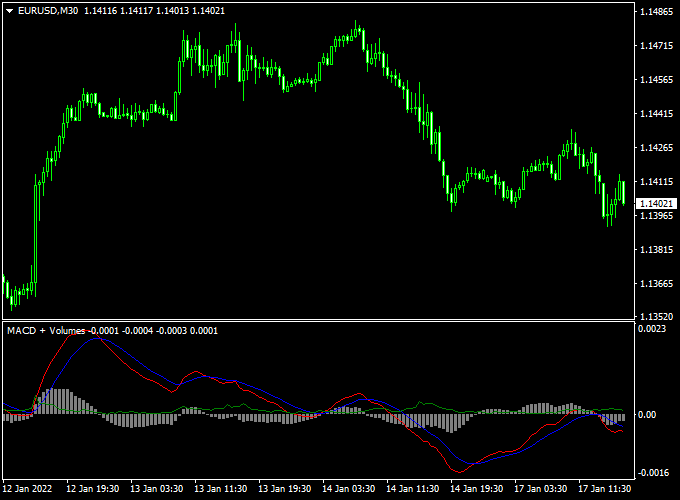
Indicator Chart
The MACD and Volume chart displays gray histogram bars, signal lines, and a volume overlay in the main chart window.
Gray bars above 0.00 indicate bullish alignment; bars below 0.00 indicate bearish alignment.
Red and blue line crossovers confirm the direction, helping traders identify high-probability entries.

Guide to Trade with MACD and Volume Indicator
Buy Rules
- Enter a buy trade when histogram bars are above 0.00 and the red line crosses above the blue line
- Confirm rising volume for stronger trend confirmation
- Wait for the candle close to support the signal before entering
Sell Rules
- Enter a sell trade when histogram bars are below 0.00 and the red line crosses below the blue line
- Confirm volume is sufficient to support the move
- Wait for the candle close to validate the signal
Stop Loss
- Place 1- 3 pips below the most recent swing low for buy trades.
- Place 1- 3 pips above the most recent swing high for sell trades.
- Consider using the previous signal line as a dynamic stop reference.
- Trail the stop slightly behind price after partial profits to lock in gains.
Take Profit
- Close part of the trade at the next visible swing high for buys or swing low for sells.
- Let the remaining position run until the histogram and signal line indicate a trend reversal.
- Use volume peaks or slowing momentum as exit signals.
- Apply a trailing stop to capture extended moves while protecting profits.
Practical Tips
- Combine with higher timeframe analysis for stronger signals
- Check volume to confirm trend strength before entering trades
- Avoid trades when histogram bars are weak or crossing frequently
MACD and Volume Indicator + Rainbow Trend Forex Multi-Timeframe Strategy
This strategy combines the MACD and Volumes Forex Indicator for MT4 with the Rainbow Trend Metatrader 4 Forex Indicator.
The MACD and Volume indicator generates a buy signal when the gray histogram is above zero and a sell signal when it is below zero.
The Rainbow Trend indicator confirms trend direction: for a buy, the red lines must be below the yellow line and the green lines above the yellow line.
For a sell, the red lines must be above the yellow line and green lines below.
This strategy works well on timeframes from M1 to H4, making it suitable for intraday and swing trading.
Why this strategy works
This strategy works by combining momentum, volume, and trend alignment.
The MACD and Volume indicator captures momentum shifts, while the Rainbow Trend confirms the trend across multiple timeframes.
Entering trades only when both indicators align increases the probability of following the main trend and reduces the likelihood of false signals.
Buy Entry Rules
- Wait for the MACD and Volumes histogram to rise above zero.
- Confirm that the Rainbow Trend shows red lines below the yellow line and green lines above the yellow line.
- Enter a buy trade at the open of the next candle after both conditions are met.
- Place the stop loss below the most recent swing low or support level.
- Take profit in stages: close half the position at the nearest minor resistance and the rest when the Rainbow Trend alignment changes or momentum weakens.
- Exit early if the MACD histogram falls below zero or the Rainbow Trend alignment reverses.
Sell Entry Rules
- Wait for the MACD and Volumes histogram to fall below zero.
- Confirm that the Rainbow Trend shows red lines above the yellow line and green lines below the yellow line.
- Enter a sell trade at the open of the next candle after both conditions are met.
- Place the stop loss above the most recent swing high or resistance level.
- Take profit in stages: close half the position at the nearest minor support and the rest when the Rainbow Trend alignment changes or momentum weakens.
- Exit early if the MACD histogram rises above zero or the Rainbow Trend alignment changes.
Advantages
- Works on multiple timeframes from M1 to H4.
- Combines momentum, volume, and trend for higher-probability trades.
- Clear visual confirmation reduces false entries.
- Adaptable for both intraday and swing trading.
- Structured stop loss and staged take profit allow better risk and reward management.
Drawbacks
- Signals can be delayed in very fast-moving markets, causing late entries.
- Sideways markets may produce conflicting signals, increasing the risk of small losses.
- Staged take profit may not fully capture trends if the trend reverses unexpectedly.
Case Study 1 – GBP/USD H1
During the London session, GBP/USD showed a gray histogram above zero on the MACD and Volumes indicator.
The Rainbow Trend confirmed a bullish alignment with red lines below the yellow line and green lines above.
A buy trade was entered at 1.2610 with a stop loss at 1.2595.
Half of the position was closed at the nearest resistance at 1.2630, and the remaining half was closed when the Rainbow Trend alignment shifted, resulting in a total gain of 30 pips.
Case Study 2 – EUR/JPY M15
During the Asian session, EUR/JPY showed a gray histogram below zero on the MACD and Volumes indicator, with a bearish Rainbow Trend alignment.
A sell trade was entered at 144.50 with a stop loss at 144.70.
Half of the position was closed at minor support at 144.30, and the remaining half when the Rainbow Trend alignment changed, resulting in a total gain of 30 pips.
Strategy Tips
- Use M1 for scalping, M15–H1 for intraday, and H4 for swing trading.
- Focus on liquid pairs like GBP/USD, EUR/JPY, EUR/USD, and AUD/USD for smoother price action.
- Combine with support and resistance levels to refine entries and staged exits.
- Adjust stop loss based on volatility and timeframe.
- Use a staged take profit to secure profits while allowing the remainder of the trade to run.
- Consider using additional filters like pivot points or moving averages to reduce false signals in low-volatility markets.
Download Now
Download the “macd and volumes.mq4” indicator for Metatrader 4
FAQ
Can the indicator be customized?
Yes. You can adjust histogram colors, signal line settings, and volume display preferences to match your trading style.
How do I interpret low volume during a signal?
Low volume indicates weak participation, which may lead to false signals.
It’s best to wait for confirmation or higher volume before entering.
Can it be used for both short-term and long-term trades?
Yes. Scalpers can trade smaller timeframes, while swing traders can focus on higher timeframes for stronger trends.
Summary
The MACD and Volume Forex indicator MT4 combines trend and volume analysis to deliver reliable buy and sell signals.
Gray histogram bars and signal line crossovers provide dual confirmation, helping traders filter weaker setups and focus on high-probability trades.
Volume plotted on the chart adds insight into market strength, giving a clear picture of trend momentum.
It is flexible for scalping, intraday, or swing trading and can be used standalone or as part of a broader strategy.
With well-placed stop losses and carefully managed take profits, the MACD and Volume indicators help protect your trades.
Monitoring volume trends gives traders a reliable tool for spotting precise, trend-aligned entries.


