About the MACD Histogram with MA Filter Indicator
The MACD Histogram with MA Filter Indicator for MetaTrader 4 is a free Forex tool that combines MACD momentum analysis with two moving averages to generate actionable trading signals.
It appears in a separate subwindow and uses a color-coded histogram to show short-term trend strength and direction.
MACD, or Moving Average Convergence/Divergence, measures the difference between fast and slow moving averages to identify momentum changes.
This indicator adds a moving average filter on top of the standard MACD histogram to improve signal reliability and reduce noise during choppy markets.
Traders can use it to identify trend entries and reversals.
Buy and sell opportunities are displayed clearly via histogram bars and optional crossover signals, allowing for flexible strategies on multiple timeframes.
Free Download
Download the “Macd histogramm with filter ma.mq4” indicator for MT4
Key Features
- Triple-colored histogram representing trend strength and direction
- Built-in moving average filter to reduce false signals
- Subwindow display for clean charting
- Optimized for MT4 and short-term trading
Indicator Chart
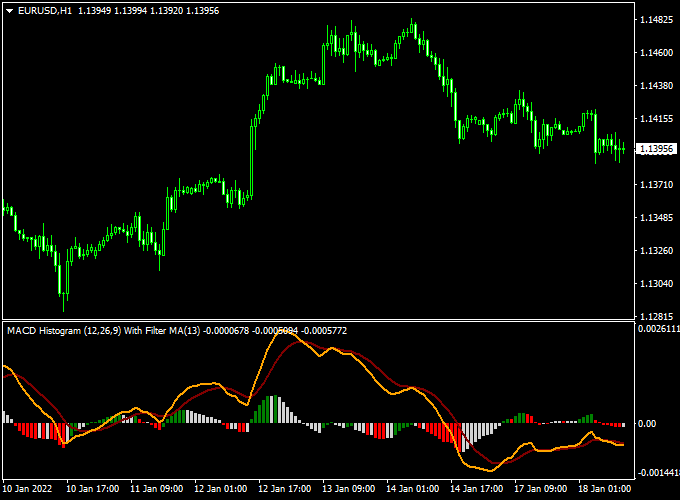
The chart below shows the MACD Histogram with MA Filter Indicator in a subwindow.
Green bars signal bullish momentum, red bars indicate bearish momentum, and neutral colors appear during sideways movement.

Guide to Trade with MACD Histogram with MA Filter Indicator
Buy Rules
- Wait for the first green histogram bar above the 0.00 level
- Confirm the moving average filter supports upward momentum
- Open a buy trade at the next candle after the signal appears
Sell Rules
- Wait for the first red histogram bar below the 0.00 level
- Check that the moving average filter aligns with downward pressure
- Open a sell trade at the next candle after the signal appears
Stop Loss
- Place stop loss slightly beyond the high or low of the signal candle
- For buy trades, set it just below the swing low
- For sell trades, set it just above the swing high
Take Profit
- Target previous intraday support or resistance zones
- Close trades when the histogram changes color opposite to your trade
- Consider partial exits during strong trending moves
Practical Tips
- Focus on major currency pairs during the London and New York sessions
- Use the MA filter as confirmation to reduce false entries in sideways markets
- Combine with basic support/resistance levels or trend lines for added confidence
MACD Histogram Indicator + Silver Trend MT4 Forex Scalping Strategy
This scalping strategy on MetaTrader 4 combines the MACD Histogram with MA Filter Indicator with the Silver Trend Indicator.
It’s built for quick trades on M1 or M5 charts when momentum and trend align.
By using the MACD Histogram with the MA Filter Indicator and the Silver Trend Indicator, you get a scalping system for MT4 that emphasizes both trend and momentum.
When the histogram moves above or below zero and the candle colors match, you can act swiftly and confidently.
With disciplined risk management and careful pair/timeframe selection, this strategy is tailored for fast, repeatable intraday trades.
Buy Entry Rules
- Wait until the MACD Histogram rises above the zero level, signaling bullish momentum.
- Confirm that the Silver Trend indicator has turned the candlesticks blue, indicating a bullish trend.
- Enter a buy trade at the close of the signal candle (or immediately on the next candle open).
- Set the stop loss a few pips below the recent swing low or just below the last blue candle’s low.
- Set the take profit at approximately 8-15 pips (for M1) or 12-20 pips (for M5)
- OR exit when the histogram falls below zero or the candlesticks turn red.
Sell Entry Rules
- Wait until the MACD Histogram drops below zero, signaling bearish momentum.
- Confirm that the Silver Trend indicator has turned the candlesticks red, indicating a bearish trend.
- Enter a sell trade at the close of the signal candle (or at the next candle open).
- Place the stop loss a few pips above the recent swing high or just above the last red candle’s high.
- Set the take profit at about 8-15 pips (for M1) or 12-20 pips (for M5)
- OR exit when the histogram climbs above zero or candlesticks switch to blue.
Advantages
- Combines momentum confirmation (MACD Histogram) with trend direction (Silver Trend colored candles) for better precision.
- Simple visual signals make entries easy and fast, which is ideal for scalping.
- Works best in high-liquidity moments when momentum moves quickly and clearly on lower timeframes.
- Clear risk management with defined stop losses, target pips, and exit rules helps manage trades efficiently.
Drawbacks
- In sideways or low-momentum markets, the histogram may hover around zero, and colored candles may flip frequently, creating false triggers.
- Because targets are small and timeframes are short, spread and execution speed matter a lot—slippage can reduce profits.
- Requires active monitoring — this is not a “set-and-forget” strategy; you’ll be monitoring charts frequently.
- The histogram and trend color change can lag slightly, so entry may come a bit after the move starts.
Case Study 1: NZDUSD M1 Buy Setup
During the Asian session on the NZDUSD pair, the MACD Histogram rose above zero at 0.6452, and the Silver Trend indicator turned the candlesticks blue.
A buy trade was entered at 0.6453 with a stop loss at 0.6445 (-8 pips) and a take profit set at 0.6463 (+10 pips).
Price moved swiftly upward within minutes, hitting the target for a clean +10 pip scalp.
The alignment of histogram momentum and trend color provided a quick, high-probability entry.
Case Study 2: EURCAD M5 Sell Setup
On the EURCAD pair in the European session, the histogram dropped below zero at 1.4220, and the candles turned red.
A sell trade was placed at 1.4218 with a stop loss at 1.4230 (+12 pips risk) and a target at 1.4200 (-18 pips).
The pair fell steadily and reached the target within about 15 minutes, yielding +18 pips.
The dual confirmation helped filter a strong move rather than a random blip.
Strategy Tips
- Stick to high-liquidity major and cross pairs (e.g., EURUSD, NZDUSD, EURCAD) when scalping lower timeframes.
- Ensure your broker offers tight spreads and fast execution since small-pip targets amplify transaction cost effects.
- Keep position size small relative to account size when scalping; many small trades add up, but risk still needs control.
Download Now
Download the “Macd histogramm with filter ma.mq4” indicator for Metatrader 4
FAQ
What do the different histogram colors indicate?
The histogram colors show trend strength and direction.
Green bars indicate bullish momentum, red bars indicate bearish momentum, and neutral colors appear when the market lacks a clear trend.
How does the MA filter improve trading signals?
The moving average filter confirms the direction of the MACD histogram signals.
Only trades that align with the MA trend are considered higher probability, helping reduce false entries during sideways markets.
Can this indicator be used for scalping or longer trades?
It is versatile. Shorter timeframes like M5 or M15 are ideal for scalping, while M30 and H1 can be used for intraday swing trades.
Adjust your stop loss and take profit according to the chosen timeframe.
Summary
The MACD Histogram with MA Filter Indicator for MT4 combines momentum analysis with moving averages to deliver easy-to-read trend signals.
Green and red histogram bars indicate bullish and bearish momentum, while the MA filter confirms trade direction.
This tool is ideal for traders looking to follow intraday trends, identify reversals, and reduce false signals in choppy markets.
Its flexible design works on multiple timeframes and currency pairs, providing a practical approach to short-term trading with clear, actionable signals.


