About the MACD Trend Histogram Bars Indicator
The MACD Trend Histogram Bars Indicator for MetaTrader 4 is a versatile tool for spotting trend momentum and timing trade entries.
It turns MACD signals into simple, color-coded bars for easy interpretation.
Displayed in a separate sub-window, the indicator uses green and red bars to indicate bullish and bearish momentum, respectively.
Traders can use it as a standalone entry tool or as an additional trend filter to confirm other signals.
Its simplicity makes it ideal for scalpers, day traders, and swing traders.
By monitoring the color changes and the strength of bars, traders can quickly react to shifts in market direction and improve trade timing.
Free Download
Download the “MACDBars.mq4” indicator for MT4
Key Features
- Bi-colored trend histogram bars for quick trend assessment
- Green bars indicate upward momentum, red bars indicate downward momentum
- Useful for trade entries and exits
- Acts as a trend confirmation tool alongside other indicators
- Displayed in a separate MT4 sub-window for clarity
Indicator Chart
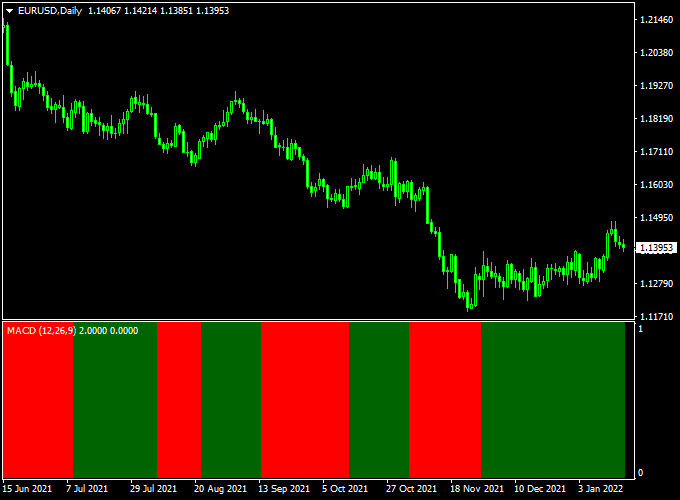
The chart below shows the MACD Trend Histogram Bars Indicator in action.
Green bars signal potential buy trades, while red bars signal potential sell trades.
The bar length represents the strength of momentum, helping traders gauge the trend.

Guide to Trade with MACD Trend Histogram Bars Indicator
Buy Rules
- Look for the first green bar to appear on the histogram
- Confirm that the price is moving upward or aligns with the overall trend
- Open a buy trade once the green bar shows consistent upward momentum
Sell Rules
- Wait for the first red bar to appear on the histogram
- Confirm that the price is moving downward or aligns with the overall trend
- Open a sell trade once the red bar shows sustained downward momentum
Stop Loss
- Place a stop loss a few pips below the lowest bar of the last downtrend for buys
- Place a stop loss a few pips above the highest bar of the last uptrend for sells
- Use the average bar size to guide stop distance if volatility is high
Take Profit
- Close trades when the histogram bars change color
- Use nearby support and resistance levels as exit points
- For scalping, aim for smaller pip targets aligned with session volatility
Practical Tips
- Combine histogram bars with price action for more reliable entries
- Check higher timeframes to confirm overall trend direction
- Wait for a few consecutive bars to confirm momentum before entering
- Keep risk per trade manageable to protect your account
Forex Trading Strategy: MACD Trend Histogram Bars & Ultimate Moving Average (MT4)
This strategy combines the MACD Trend Histogram Bars and the Ultimate Moving Average (UMA) indicators on MetaTrader 4 (MT4) to identify high-probability buy and sell opportunities.
The MACD Trend Histogram Bars indicator provides momentum insights, while the UMA offers a smoothed trend-following signal.
This strategy is suitable for day trading on M15 and H1 timeframes and works well for pairs like EUR/USD, GBP/USD, and USD/JPY.
Buy Entry Rules
- Wait for the MACD Trend Histogram Bars to display green bars, indicating bullish momentum.
- Ensure the UMA line is below the price, confirming an uptrend.
- Enter a buy position when both conditions are met.
- Set a stop loss below the recent swing low or a fixed number of pips, depending on your risk tolerance.
- Set a take profit target at the next significant resistance level or use a risk-to-reward ratio of at least 1:2.
Sell Entry Rules
- Wait for the MACD Trend Histogram Bars to display red bars, indicating bearish momentum.
- Ensure the UMA line is above the price, confirming a downtrend.
- Enter a sell position when both conditions are met.
- Set a stop loss above the recent swing high or a fixed number of pips.
- Set a take profit target at the next significant support level or use a risk-to-reward ratio of at least 1:2.
Advantages
- Combines momentum and trend-following indicators for higher probability trades.
- Reduces market noise, allowing for clearer trade signals.
- Works effectively on M15 and H1 timeframes for day trading.
- Helps in identifying trend reversals and continuations with minimal lag.
Drawbacks
- Requires active monitoring of charts; not suitable for completely automated trading.
- Not ideal for low-liquidity pairs due to potential slippage and wider spreads.
Case Study 1: EUR/USD M15 Buy
On the EUR/USD M15 chart, the MACD Trend Histogram Bars displayed green bars, indicating bullish momentum.
The UMA line was below the price, confirming an uptrend.
A buy position was entered at 1.1050.
The stop loss was set at 1.1030 (-20 pips), and the take profit target was set at 1.1070 (+20 pips).
The price moved upward and hit the take profit level within the session, resulting in a +20 pip gain.
Case Study 2: GBP/USD H1 Sell
During the London session on GBP/USD H1, the MACD Trend Histogram Bars displayed red bars, indicating bearish momentum.
The UMA line was above the price, confirming a downtrend.
A sell position was entered at 1.2800. The stop loss was set at 1.2820 (+20 pips), and the take profit target was set at 1.2770 (-30 pips).
The price declined steadily and reached the take profit level within the session, resulting in a +30 pips profit.
Strategy Tips
- Use M15 and H1 charts for day trading to capture intraday trends.
- Focus on major currency pairs like EUR/USD, GBP/USD, and USD/JPY for better liquidity.
- Always apply proper risk management with stop losses and take profit targets.
Download Now
Download the “MACDBars.mq4” indicator for Metatrader 4
FAQ
How do I know when momentum is strong?
Longer bars in the histogram indicate stronger momentum. Short or fading bars suggest the trend may be weakening.
Can I use this indicator with other trend tools?
Yes. It works well with moving averages, support/resistance levels, and trendlines to confirm trades.
How can I avoid most false signals?
Confirm histogram signals with the overall trend, higher timeframe analysis, and key support/resistance levels before entering trades.
Summary
The MACD Trend Histogram Bars Indicator for MT4 turns MACD momentum into clear green and red bars for quick interpretation.
Green bars suggest buying, red bars suggest selling, and bar length shows the strength of the move.
Used alone or as a trend filter, this indicator helps traders spot entries, exits, and trend shifts with confidence.
Combined with support/resistance and proper risk management, it is an effective tool for scalping, intraday, and swing trading strategies.


