
About the Mouteki Demark Trend Indicator
The Mouteki Demark Trend indicator for MT4 is an advanced version of the traditional Demark tool, designed to identify key trend lines from significant highs and lows.
It allows traders to spot breakout levels and potential price targets directly on the chart.
The indicator displays upper and lower trend lines, showing where bullish and bearish momentum may develop.
By using the indicator, traders can follow pure price action trend signals without lag, making entries more timely.
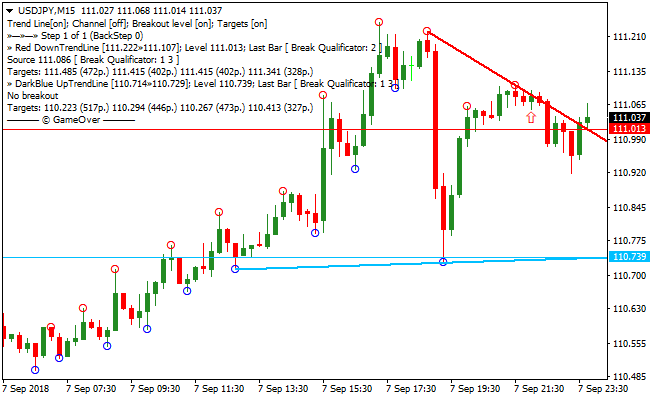
In the upper left corner of the chart, it provides breakout price levels and targets for both upward and downward trends.
The Mouteki Demark Trend indicator is flexible and works on any currency pair or timeframe, making it suitable for day traders and swing traders alike.
Free Download
Download the “mouteki-demark-trend-indicator.mq4” MT4 indicator
Key Features
- Draws major trend lines based on significant high and low prices.
- Highlights potential breakout points and target prices.
- Color-coded trend lines for easy bullish and bearish identification.
- Pure price action tool with no lag for accurate entries.
- Provides clear breakout signals for both buy and sell trades.
Indicator Chart
The Mouteki Demark Trend indicator chart displays red resistance lines for bullish breakout levels and blue support lines for bearish breakout levels.
The chart allows traders to identify price action breakout points and set entry and target levels efficiently, helping to trade in line with the prevailing trend.
Guide to Trade with the Mouteki Demark Trend Indicator
Buy Rules
- Open a buy order when the price closes above the upper red resistance trend line.
- Confirm the breakout is valid and not a false spike.
- Enter at the close of the breakout candle.
- Avoid buying if price fails to hold above the resistance line.
Sell Rules
- Open a sell order when the price closes below the lower blue support trend line.
- Confirm the breakout is supported by momentum or volume.
- Enter at the close of the breakout candle.
- Avoid selling if price closes back above the support line.
Stop Loss
- Set stop loss just below the breakout candle for buy trades.
- Set stop loss just above the breakout candle for sell trades.
- Use the last swing low (for buys) or swing high (for sells) as a reference.
Take Profit
- Close trades when price reaches the next significant support or resistance level.
- Alternatively, exit if the opposite trend line is tested or broken.
- Consider partial profit-taking at key chart levels to secure gains.
- Trail the stop behind price movement to capture extended trends.
MT4 Strategy: Mouteki Demark Trend + Bollinger Bands MACD Signals Trend Method
This MT4 strategy combines the Mouteki Demark Trend Indicator and the Bollinger Bands MACD Signals Indicator to capture reliable intraday trend trades.
The Mouteki Demark Trend shows buy opportunities when the price closes above the upper red resistance trend line and sell opportunities when it closes below the lower blue support trend line.
The Bollinger Bands MACD Signals indicator confirms sentiment using a green dotted line for bullish momentum and a magenta dotted line for bearish momentum.
Combining these indicators improves the accuracy of trend-following trades.
This strategy works best on M15, M30, and H1 charts, providing a balance between signal reliability and trading frequency.
By using trend confirmation from both price action and momentum, traders can avoid false breakouts and increase the probability of entering successful intraday trades.
This method is suitable for traders looking to catch medium-term trend moves during active market sessions.
Buy Entry Rules
- The price closes above the upper red trend line on the Mouteki Demark Trend indicator.
- The Bollinger Bands MACD Signals indicator shows a green dotted line, confirming bullish momentum.
- Enter the trade after both conditions are met.
- Place a stop loss below the recent swing low or support level.
- Take profit when the price reverses below the upper trend line or the green dotted line turns magenta.
Sell Entry Rules
- The price closes below the lower blue trend line on the Mouteki Demark Trend indicator.
- The Bollinger Bands MACD Signals indicator shows a magenta dotted line, confirming bearish momentum.
- Enter the trade after both conditions are met.
- Place a stop loss above the recent swing high or resistance level.
- Take profit when the price reverses above the lower trend line or the magenta dotted line turns green.
Advantages
- Combining trend breakout signals with momentum confirmation improves trade accuracy.
- Suitable for multiple timeframes, making it flexible for day trading.
- Helps traders avoid false breakouts by requiring alignment between price action and momentum.
- Applicable across various major and minor currency pairs.
Drawbacks
- Breakouts can be followed by sudden retracements, hitting stop losses.
- Requires patience to wait for both conditions to align, limiting trade frequency.
- Not designed for very short-term scalping.
- News events can trigger unexpected price spikes, affecting trade outcomes.
Case Study 1: EURGBP M30
During the London session, EURGBP closed above the upper red Mouteki trend line while the Bollinger Bands MACD Signals showed a green dotted line.
A buy trade was entered with a stop loss below the recent swing low.
Price continued upward and the trade was closed when the green dotted line turned magenta, capturing a 25 pip gain.
The combination of breakout and momentum confirmation resulted in a strong intraday trend trade.
Case Study 2: USDCHF H1
USDCHF closed below the lower blue Mouteki trend line and the Bollinger Bands MACD Signals showed a magenta dotted line during the New York session.
A sell trade was executed with a stop above the recent swing high.
Price moved downward steadily and the trade was closed when the magenta line turned green, securing a 28 pip profit.
Aligning both indicators helped identify a high-probability trend continuation trade.
Strategy Tips
- Focus on currency pairs with strong trending behavior during active sessions.
- Confirm both trend breakout and momentum signals before entering trades to reduce false entries.
- Place stop losses at logical support or resistance points to manage risk effectively.
- Consider using trailing stops when capturing longer intraday trends.
- Use the change of the dotted line color as a simple and reliable exit signal.
- Monitor multiple timeframes to ensure the breakout aligns with the higher timeframe trend.
Download Now
Download the “mouteki-demark-trend-indicator.mq4” Metatrader 4 indicator
FAQ
What do the red and blue trend lines indicate?
Red trend lines mark resistance and bullish breakout levels. Blue trend lines mark support and bearish breakout levels.
Does it require other indicators for confirmation?
No. The indicator is based on price action and trend line breakouts.
However, combining it with volume or momentum tools can increase confidence in breakout trades.
Can I adjust the trend line sensitivity?
Yes. The indicator allows customization in the input menu to match your preferred trading style and timeframe.
Summary
The Mouteki Demark Trend indicator for MT4 provides traders with precise, no-lag breakout signals using major trend lines.
It highlights potential buy and sell opportunities based on price closing above resistance or below support lines.
Flexible across all currency pairs and timeframes, it suits both day traders and swing traders.
The indicator simplifies trend line analysis, improves trade timing, and helps traders follow price action effectively for more accurate entries and exits.


