
About the Moving Average 3 Colors MTF Indicator
The Moving Average 3 Colors MTF Indicator for MT4 is a versatile trend system built around three colored moving averages.
It’s designed to help traders spot strong bullish and bearish momentum with clarity, while also being multi-timeframe (MTF) enabled by default.
Green, red, and yellow moving averages visually track market direction across multiple timeframes.
By observing how candlesticks interact with these lines, traders can identify moments when the trend is strongly bullish or bearish.
This indicator works well both as a standalone trading system and as a filter to support other strategies.
Its simplicity makes it accessible for beginners, while the MTF functionality provides an extra edge for experienced traders who want to confirm trend strength across higher or lower timeframes.
Free Download
Download the “ma 3×3 colors mtf.mq4” indicator for MT4
Key Features
- Triple-colored moving averages to indicate trend direction
- MTF-enabled to monitor multiple timeframes simultaneously
- Signals strong bullish or bearish momentum
- Can be used for trade entries, exits, or as a trend confirmation tool
- Suitable for multiple currency pairs and timeframes
- Simple visual signals for beginner and advanced traders
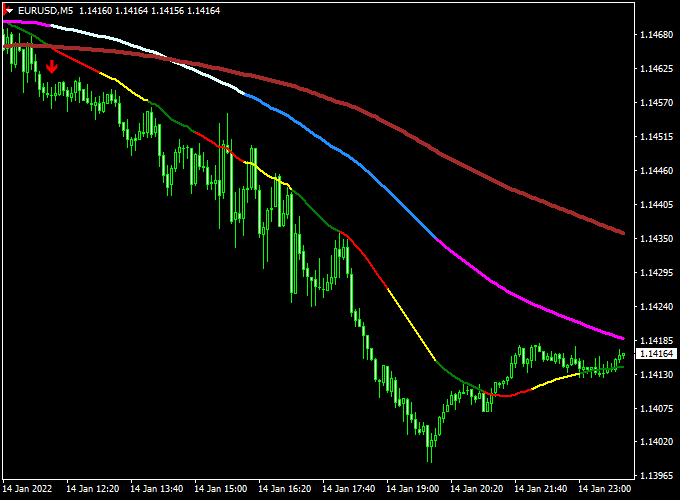
Indicator Chart
The chart shows the Moving Average 3 Colors MTF Indicator applied to an MT4 price chart.
When the candlestick crosses all moving averages from bottom to top, it indicates a strong bullish signal.
When the candlestick crosses all moving averages from top to bottom, it signals a strong bearish trend.
Traders can follow these signals to enter trades in the direction of the trend.
Guide to Trade with Moving Average 3 Colors MTF Indicator
Buy Rules
- Go long when the candlestick crosses all moving averages from bottom to top
- Enter the trade at the opening of the next candle
Sell Rules
- Go short when the candlestick crosses all moving averages from top to bottom
- Enter the trade at the opening of the next candle
Stop Loss
- For buy trades, place a stop loss below the most recent swing low or below the last bullish crossover
- For sell trades, place a stop loss above the most recent swing high or above the last bearish crossover
Take Profit
- Exit trades when the candlestick crosses back across the moving averages in the opposite direction
- Optional: use a fixed risk-to-reward ratio for partial or full profit-taking
Practical Tips
- MTF functionality allows you to see bigger trend alignment before entering trades
- Be patient and wait for full crossover confirmation for the strongest trades
Moving Average 3 Colors MTF & Waddah Attar Forex Scalping Strategy
This MT4 scalping strategy combines the Moving Average 3 Colors MTF Indicator and the Waddah Attar Trend Scalper Indicator to capture short-term price movements.
The Moving Average 3 Colors MTF Indicator identifies trend direction: bullish when all moving averages slope upwards, bearish when all slope downwards.
The Waddah Attar indicator confirms buy signals with a green histogram and sell signals with a red histogram.
This strategy is designed for GBP/USD, USD/CHF, GBP/JPY, and EUR/USD on 5-minute and 15-minute charts, aiming for 5–10 pips per trade.
Buy Entry Rules
- Confirm all moving averages are sloping upwards for a bullish trend.
- Wait for the Waddah Attar Trend Scalper histogram to turn green.
- Enter a buy trade at the opening of the next candle after the green histogram appears.
- Place a stop loss 3–5 pips below the entry point.
- Set take profit at 5–10 pips.
- Close the trade immediately if the histogram changes from green to red.
Sell Entry Rules
- Confirm all moving averages are sloping downwards for a bearish trend.
- Wait for the Waddah Attar Trend Scalper histogram to turn red.
- Enter a sell trade at the opening of the next candle after the red histogram appears.
- Place a stop loss 3–5 pips above the entry point.
- Set take profit at 5–10 pips.
- Close the trade immediately if the histogram changes from red to green.
Advantages
- Combines trend confirmation with signal confirmation for higher probability trades.
- Ultra-fast scalping is suitable for 5-minute and 15-minute charts.
- Clear visual entries and exits using a histogram and trend slope.
- Small pip targets reduce exposure while allowing frequent profit-taking.
Drawbacks
- The strategy may generate false signals during ranging or sideways markets.
- Frequent trades can lead to overtrading if risk management is not disciplined.
- Performance may vary between different currency pairs, requiring testing for each pair.
- Small pip targets mean a single loss can offset multiple winning trades if not careful.
Case Study 1: GBP/JPY 5-Minute Chart
All moving averages were sloping upwards, indicating a bullish trend.
The Waddah Attar histogram turned green.
A buy trade was entered at the next candle, with a stop loss 4 pips below entry and take profit set at 8 pips.
The trade reached the target, and the position was closed when the histogram turned red.
Case Study 2: EUR/USD 15-Minute Chart
All moving averages were sloping downwards, indicating a bearish trend.
The Waddah Attar histogram turned red.
A sell trade was entered at the next candle, with a stop loss 5 pips above entry and take profit set at 10 pips.
The trade reached the target, and the position was closed when the histogram turned green.
Strategy Tips
- Combine the strategy with a higher timeframe trend analysis to filter low-probability trades.
- Keep a trading journal to track which currency pairs perform best with this strategy.
- Adjust your stop loss slightly wider during highly volatile periods to avoid early exits.
- Consider scaling out of trades partially when near take profit to lock in gains.
- Always check for upcoming economic news events to reduce the risk of unexpected volatility.
Download Now
Download the “ma 3×3 colors mtf.mq4” indicator for Metatrader 4
FAQ
Can I use this indicator on multiple timeframes?
Yes, the MTF feature allows you to track trends on higher or lower timeframes while trading on your preferred chart.
What does it mean when the candlestick crosses all moving averages?
A crossover of all moving averages from bottom to top signals strong bullish momentum, while a top-down crossover signals strong bearish momentum.
Can it be combined with other indicators?
Yes. Many traders use it with oscillators, volume tools, or trend filters to confirm strong trade entries and reduce false signals.
Summary
The Moving Average 3 Colors MTF Indicator for MT4 provides clear, visual signals for trading strong trends.
Its multi-timeframe support allows traders to confirm market direction across different periods, ensuring high-probability entries.
Beginner-friendly yet powerful, it works well as a standalone system or alongside other strategies.
When combined with proper risk management and confirmation tools, it helps traders capitalize on strong bullish and bearish momentum efficiently.


