
About the Multi Currency Pair Charts Indicator
The Multi Currency Pair Charts indicator for Metatrader 4 displays multiple small currency pair charts in a dedicated sub-window of your MT4 platform.
It gives you a fast overview of selected currency pairs or instruments without needing to switch chart tabs.
This tool helps traders monitor several markets at once, making it easier to spot correlations, emerging trends, or conditions across pairs and instruments.
Whether you trade major forex pairs, exotic FX, indices, stocks, or cryptocurrencies, the indicator gives you a consolidated glance at price behavior.
The indicator is flexible and can be customized by editing its input settings.
You choose the symbols you want to display and how many micro-charts appear in the panel.
Because it supports all trading instruments, it’s a versatile addition to any trader’s MT4 setup.
Free Download
Download the “Multi currency symbols chart.mq4” indicator for MT4
Key Features
- Displays multiple mini-charts in one indicator window on MT4.
- Supports forex pairs, indices, stocks, cryptos, and commodities.
- Customizable input settings for symbols and layout.
- Helps monitor several markets without tab switching.
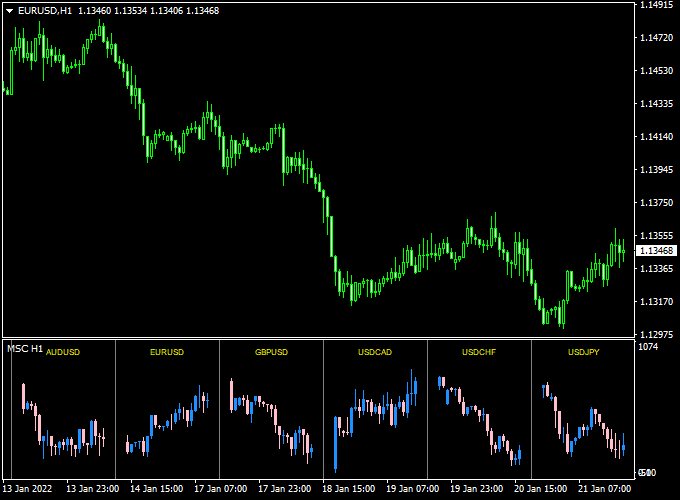
Indicator Chart
The Multi Currency Pair Charts Indicator shows a panel of small price charts below your main chart.
Each mini-chart tracks a different symbol chosen in the input settings.
This layout gives you a side-by-side view of price action across pairs or instruments.
You can compare trend direction, momentum, and recent swings across multiple markets at a glance.
Guide to Trade with Multi Currency Pair Charts Indicator
Buy Rules
- Choose the instruments you want to monitor in the indicator inputs.
- Watch the mini-charts for alignment in trend direction across pairs.
- Spot pairs with bullish setups on the panel.
- Enter buy trades when your main chart’s price and mini-chart trends align.
Sell Rules
- Watch the panel for bearish alignment across multiple mini-charts.
- Confirm bearish setups on your primary trading chart.
- Enter sell trades when trend direction matches the mini-charts.
- Avoid entries when signals are mixed across pairs.
Stop Loss
- Set stop loss at logical price levels such as recent swing highs/lows.
- Avoid overly tight stops during cross-market volatility.
- Use the panel to gauge overall market volatility before placing stops.
- Adjust stop loss if mini-charts show conflicting momentum.
Take Profit
- Use key support or resistance levels on your main chart for profit targets.
- Monitor mini-charts for weak signals nearing profit levels.
- Take partial profits if multiple markets show reversal signs.
- Exit fully if the trend direction shifts across the panel.
Practical Tips
- Select only the most relevant pairs or instruments to avoid clutter.
- Use this tool as a situational overview rather than a standalone entry signal.
- Match trends across mini-charts for higher probability setups.
- Combine with price action or volume tools for better context.
- Review different timeframes to confirm multi-market momentum.
Multi-Currency Chart and Trend Predictor Indicator Forex Day Trading Strategy
The Multi-Currency Pair Charts Indicator and the Trend Predictor V1.0 Forex Indicator can be combined to build an effective day trading strategy for MT4.
This approach allows traders to identify the strongest trends across different pairs while timing entries with precise buy and sell signals.
It is especially useful for traders who monitor several pairs throughout the day and prefer to trade with confirmation from both market structure and directional momentum.
The Multi-Currency Charts indicator displays several small live charts in a separate window at the bottom of your platform, helping you spot which pairs are trending strongly.
Once a strong trend is identified, the Trend Predictor indicator provides a blue arrow for a buy signal or a red arrow for a sell signal.
This combination makes it easier to focus on high-quality setups and avoid pairs that are ranging or lacking volatility.
Buy Entry Rules
- Open your main chart and watch the small charts in the Multi-Currency window to find pairs showing steady upward trends.
- Once a strong bullish pair is identified, wait for a blue arrow to appear on the main chart from the Trend Predictor indicator.
- Enter a buy trade when the next candle opens after the blue arrow forms.
- Place a stop loss below the most recent swing low or below a key support level.
- Use a dynamic take profit target based on volatility.
- For example, take 60% of the average daily range (ADR) or exit at the next resistance zone.
Sell Entry Rules
- Look at the Multi-Currency window to find pairs showing clear downward trends.
- Wait for a red arrow from the Trend Predictor indicator on the main chart to confirm a sell setup.
- Enter a sell trade once the next candle opens after the red arrow appears.
- Place a stop loss above the nearest swing high or resistance area.
- Take profit using a flexible target, such as 50% to 70% of the pair’s daily range or near a key support level.
Advantages
- Allows monitoring multiple pairs simultaneously for better trade selection.
- Combines broad market awareness with specific entry timing.
- Helps traders identify the strongest trending pairs of the day.
- Reduces time spent switching between charts.
- Can be applied to any major or cross pair during active sessions.
Drawbacks
- Requires a large enough screen or setup to view multiple charts comfortably.
- False signals may appear in low-volatility sessions.
- Not suitable for scalping due to broader analysis and trend confirmation steps.
- Performance can vary depending on the pair’s volatility and session timing.
Case Study 1: EUR/USD H1 Example
In the Multi-Currency window, EUR/USD and GBP/USD showed clear upward momentum during the London session.
On the main EUR/USD chart, a blue arrow appeared from the Trend Predictor indicator at 1.0765, confirming the bullish move.
A buy trade was entered with a stop loss at 1.0745.
The average daily range was around 80 pips, so the take profit target was set at 60% of ADR, or about 48 pips.
The trade closed at 1.0813 with a gain of 48 pips within four hours.
Case Study 2: USD/JPY H1 Example
In this setup, USD/JPY displayed a clear downward movement among several pairs during the New York session.
A red arrow appeared from the Trend Predictor indicator at 149.30, signaling a sell entry.
A trade was opened at the next candle with a stop loss at 149.60.
The ADR was 90 pips, so a take-profit target of 55 pips (around 60% ADR) was set.
The price fell steadily to 148.75 within the next trading session, producing a 55-pip profit before reversing.
Strategy Tips
- Use this strategy during the London and New York sessions when volatility is high.
- Focus on pairs showing clear trends across multiple mini charts in the Multi-Currency window.
- Adjust take profit targets based on each pair’s volatility or average daily range.
- Close trades early if the Trend Predictor gives an opposite signal.
- Keep risk per trade below 2% and avoid overexposure to correlated pairs.
Download Now
Download the “Multi currency symbols chart.mq4” indicator for Metatrader 4
FAQ
Can I display non-forex instruments?
Yes, the indicator works with all MT4-supported instruments including stocks, indices, cryptocurrencies, and commodities.
How many mini-charts can I display?
The number of mini-charts depends on your input settings.
You can choose symbols and layout to suit your screen and strategy.
Can it replace switching chart tabs?
Yes, that’s its main benefit.
It gives you an at-a-glance view of multiple instruments without manual tab changes.
Summary
The Multi Currency Pair Charts Indicator for Metatrader 4 gives traders a consolidated view of multiple symbols in one sub-window of MT4.
This lets you observe price action across pairs, indices, stocks, and cryptos without switching between charts.
Use the mini-charts to spot trend alignment or divergence across markets.
For buy setups, look for bullish alignment across your panel that matches your main chart’s bias.
For sell setups, look for bearish alignment before entering.
With customizable inputs, this tool adapts to your trading focus and helps you monitor markets more efficiently.


