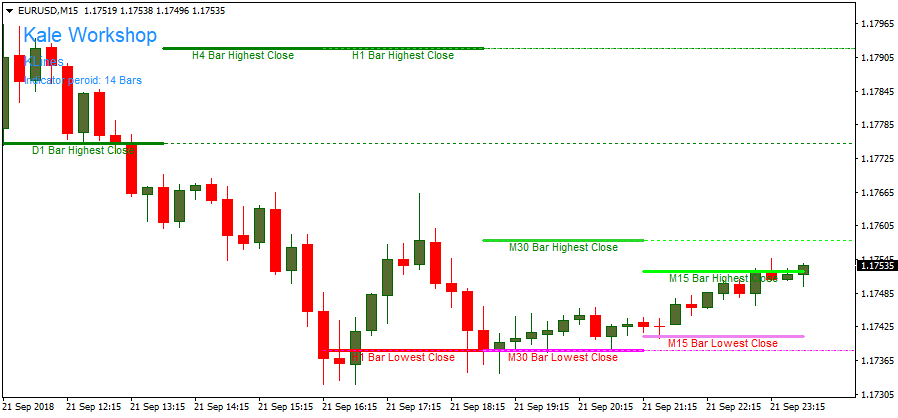
The Multi Timeframes Support & Resistance forex indicator is a very handy tool for all kind of currency traders.
It displays the highest (resistance) and lowest (support) bar close price line for multiple timeframes.
The following timeframes are supported: M1, M5, M30, H1, H4 and D1.
Ideas:
– You can spot important area’s of support and resistance on the same chart in just seconds.
For example, looking at the chart more down below, the EUR/USD 15-minute chart contains the highest and lowest bar close prices for M30, H1, H4 and D1 charts.
– It gives you an idea where to open a possible breakout trade position, for example, when price breaks above or below significant resistance or support area’s.
– It gives you also an idea where to place your stop-loss (below support/above resistance) or even where to exit an open position (before support/resistance levels).
Free Download
Download the “klines-indicator.mq4” MT4 indicator
Example Chart
The EUR/USD 15-minute chart below displays the Multi Timeframes Support & Resistance Metatrader 4 Forex indicator in action.
Basic Trading Signals
Signals from the Multi Timeframes Support & Resistance MT4 forex indicator are easy to interpret and goes as follows:
Buy Signal: Go long when price breaks and closes above resistance.
Sell Signal: Go short when price breaks and closes below support.
Stop-Loss: Place stop-loss below support (buy trade) or above resistance (sell trade).
Download
Download the “klines-indicator.mq4” Metatrader 4 indicator
MT4 Indicator Characteristics
Currency pairs: Any
Platform: Metatrader 4
Type: Chart pattern indicator
Customization options: Variable (KL Period) Colors, width & Style.
Time frames: 1-Minute, 5-Minutes, 15-Minutes, 30-Minutes, 1-Hour, 4-Hours, 1-Day, 1-Week, 1-Month
Type: Multi Support/Resistance
Installation
Copy and paste the klines-indicator.mq4 indicator into the MQL4 indicators folder of the Metatrader 4 trading platform.
You can access this folder from the top menu as follows:
File > Open Data Folder > MQL4 > Indicators (paste here)


