About the Multi Trend Bars Indicator
The Multi Trend Bars indicator for MT4 is a simple yet powerful trading tool that highlights the current market trend using multiple small colored bars directly on the main price chart.
Each bar reflects short-term trend direction, helping traders quickly gauge market momentum across any currency pair or timeframe.
Green bars indicate bullish conditions, signaling that buyers are in control, while red bars highlight bearish conditions, signaling that sellers dominate.
When all bars align in one color, it indicates a strong trend, providing high-probability trade opportunities.
This indicator can be used as a standalone buy/sell tool or in combination with other technical indicators for trend confirmation.
Free Download
Download the “trend-test.mq4” MT4 indicator
Key Features
- Displays multiple small trend bars directly on the main MT4 chart.
- Green bars signal a bullish trend; red bars signal a bearish trend.
- Can be used as a standalone trend indicator or combined with other tools.
- Provides quick visual confirmation of strong trend alignment.
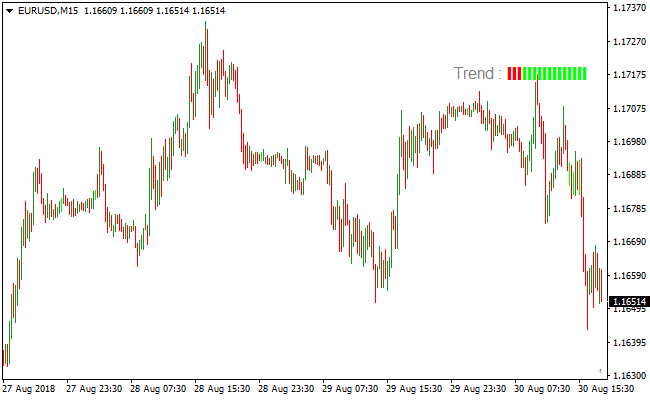
Indicator Chart
The Multi Trend Bars indicator chart displays multiple small green and red bars on the main trading chart.
The image illustrates how the indicator provides a buy signal when all bars turn green, marking a strong bullish trend.
A sell signal appears when all bars turn red, marking a strong bearish trend.
Traders can follow these color-coded bars to align trades with the current market momentum.

Guide to Trade with the Multi Trend Bars Indicator
Buy Rules
- Wait for all Multi Trend Bars to turn green, signaling a strong bullish trend.
- Confirm the trend direction with price action or another trend-following tool if desired.
- Enter a buy trade at the close of the confirming candle.
- Avoid entering during periods of sideways consolidation or low liquidity.
Sell Rules
- Wait for all Multi Trend Bars to turn red, signaling a strong bearish trend.
- Confirm bearish momentum using price action or a supporting indicator.
- Enter a sell trade at the close of the confirming candle.
- Avoid selling near strong support zones or during consolidation.
Stop Loss
- Set the stop loss just below recent support for buy trades.
- Set the stop loss just above recent resistance for sell trades.
- Move the stop loss to break-even after the trade moves a predetermined distance in your favor.
- Adjust stops if volatility increases or key levels are approached.
Take Profit
- Close the trade when the bars change color in the opposite direction.
- Alternatively, target nearby support or resistance levels for exits.
- Partial profits can be taken at predetermined pip targets.
- Let trades run if the trend remains strong and aligned with the indicator.
Multi Trend Bars and Sadukey Forex Trend Strategy
This MT4 forex strategy combines trend strength analysis from the Multi Trend Bars indicator with precise entry signals from the Sadukey indicator.
The strategy focuses on capturing strong trend movements by entering trades only when both trend direction and momentum align.
The Multi Trend Bars indicator visually displays market trend strength using colored bars.
When all bars are green, the market is experiencing a strong bullish trend. When all bars are red, the market is in a strong bearish trend.
The Sadukey indicator provides clear buy and sell dots that help traders enter at optimal points within these trends.
This strategy works best on M15, M30, and H1 charts.
It is suitable for traders who want a structured trend-following approach with clear visual signals.
Buy Entry Rules
- The Multi Trend Bars indicator must display all green bars, confirming a strong bullish trend.
- The Sadukey indicator must plot a blue dot on the chart.
- Enter the buy trade at the close of the candle where the blue dot appears.
- Stop loss is placed below the most recent swing low or below the nearest green bar cluster.
- Take profit is set near the next resistance zone or exit when the Multi Trend Bars start showing mixed colors.
Sell Entry Rules
- The Multi Trend Bars indicator must display all red bars, confirming a strong bearish trend.
- The Sadukey indicator must plot a red dot on the chart.
- Enter the sell trade at the close of the candle where the red dot appears.
- Stop loss is placed above the most recent swing high or above the nearest red bar cluster.
- Take profit is set near the next support zone or exit when the Multi Trend Bars start showing mixed colors.
Advantages
- Combines clear trend strength confirmation with precise entry timing for high probability trades.
- Visual Multi Trend Bars and Sadukey dots simplify trade decisions and reduce hesitation.
- Filters out weak or uncertain market conditions, focusing only on strong trends.
- Effective across multiple timeframes and currency pairs, providing flexibility for traders.
- Helps maintain disciplined trend-following, minimizing impulsive entries.
- Provides both entry and exit guidance, allowing for structured trade management.
Drawbacks
- Signals may be infrequent during slow or sideways market conditions.
- Not suitable for scalpers who require constant trading opportunities.
- Mixed bar conditions require trader judgment, adding some subjectivity to exits.
- Unexpected news events can disrupt valid setups, requiring active risk management.
Case Study 1
On USDCHF M30 during the London session, the Multi Trend Bars displayed all green bars, confirming strong bullish momentum.
Shortly after, a blue dot appeared from the Sadukey indicator.
A buy trade was entered at candle close, with stop loss below the recent swing low.
Price continued upward and the trade was exited near a resistance zone when the Multi Trend Bars showed mixed colors, capturing 44 pips.
Case Study 2
On EURCAD H1 during the New York session, the Multi Trend Bars showed all red bars, signaling a strong bearish trend.
A red dot appeared from the Sadukey indicator, confirming a sell opportunity.
A trade was opened at candle close, with a stop loss set above the recent swing high.
Price moved downward steadily and the position was closed near support as the Multi Trend Bars began showing mixed colors, securing 72 pips.
Strategy Tips
- Trade only when Multi Trend Bars show uniform color to ensure strong trend alignment.
- Use Sadukey dots for timing entry within the confirmed trend direction.
- Focus on higher timeframes to reduce false signals caused by minor price fluctuations.
- Monitor key support and resistance zones to guide take profit levels.
- Close trades if Multi Trend Bars start showing mixed colors to lock in profits.
- Stick to liquid pairs during active sessions for smoother price action.
Download Now
Download the “trend-test.mq4” Metatrader 4 indicator
FAQ
Can the Multi Trend Bars indicator be used alone?
Yes, it provides strong buy and sell signals on its own.
Many traders still use additional confirmation from price action or oscillators to reduce risk.
How should I use the indicator during the London and New York sessions?
For short-term trades, monitor the indicator during these high-liquidity sessions.
Strong trends are easier to identify, and signals are more reliable during these periods.
Summary
The Multi Trend Bars indicator simplifies trend detection by displaying multiple small colored bars that reflect bullish and bearish momentum.
Strong trend alignment provides clear opportunities for entering trades in the direction of the market.
Adjustable settings allow traders to tailor the indicator for scalping, intraday, or swing strategies.
By following the alignment of all bars, traders can improve timing, reduce false entries, and manage risk more effectively.
This tool can enhance trading confidence and consistency, making it a versatile tool for any forex trader.


