
The MultiRSI forex indicator for MT4 displays multi timeframe RSI oscillators in one easy to read separate window below the main activity chart.
The RSI fluctuates between 0 and 100. RSI values above 70 are overbought, below 30 are oversold.
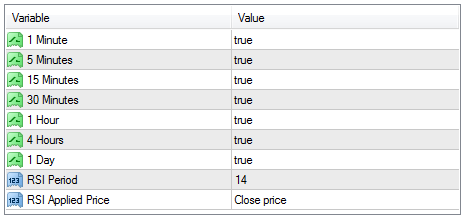
The following RSI timeframe’s can be displayed:
1-Minute, 5-minutes, 15-minutes, 30-minutes, 1 Hour, 4 Hour and 1 day.
Free Download
Download the “MultiRSI.mq4” MT4 indicator
Example Chart
The GBP/JPY M15 chart below displays the MultiRSI forex indicator in action.

Basic Trading Signals
Signals from the RSI oscillator are easy to interpret and goes as follows:
Buy Trade: Open buy order when the RSI oscillator crosses back above the 30 level from below (oversold market conditions).
Sell Trade: Open sell order when the RSI oscillator crosses back below the 70 level from above (overbought market conditions).
Tip: Use this indicator in conjunction with a trend-following indicator and take signals from the RSI in the direction of the overall trend.
Download
Download the “MultiRSI.mq4” Metatrader 4 indicator
MT4 Indicator Characteristics
Currency pairs: Any
Platform: Metatrader 4
Type: chart pattern
Customization options: Variable (Select Timeframe’s, RSI Period, RSI Applied Price) Colors, width & Style.
Time frames: 1-Minute, 5-Minutes, 15-Minutes, 30-Minutes, 1-Hour, 4-Hours, 1-Day
Type: Oscillator
Installation
Copy and paste the MultiRSI.mq4 indicator into the MQL4 indicators folder of the Metatrader 4 trading platform.
You can access this folder from the top menu as follows:
File > Open Data Folder > MQL4 > Indicators (paste here)


