About the Nelly Elliott Wave Forex Indicator
The Nelly Elliott Wave Forex Indicator for MT4 (Metatrader 4) translates the complex Elliott Wave theory into an intuitive tool that highlights wave patterns directly on your chart.
This helps traders interpret the underlying rhythm of market moves without manually drawing or counting waves.
Driven by price action logic, it adapts dynamically as market structure unfolds.
The indicator identifies impulsive and corrective wave sequences, allowing traders to anticipate where price may continue or reverse.
It reduces guesswork and supports decision-making based on well-established Elliott principles.
Whether you trade pullbacks, continuations, or trend exhaustion, the indicator provides context on wave structure that aligns with price behavior.
Free Download
Download the “nelly elliot wave.mq4” indicator for MT4
Key Features
- Automatically identifies Elliott Wave patterns on price charts.
- Displays impulsive and corrective waves based on price action.
- Helps predict trend continuation or reversal zones.
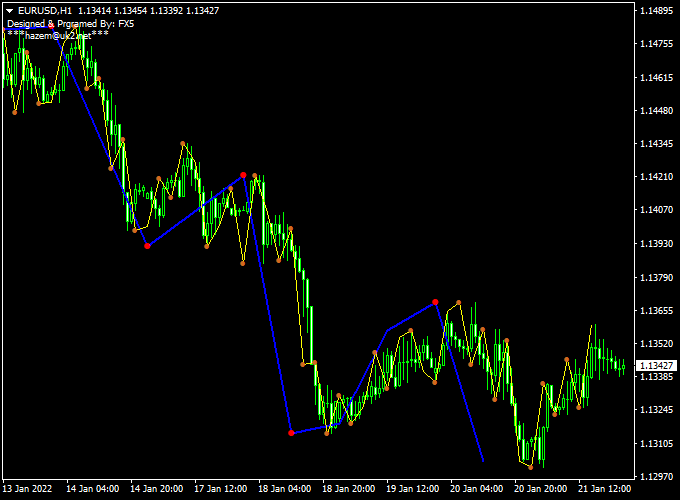
Indicator Chart
The Nelly Elliott Wave chart shows wave counts directly on the price chart.
Impulsive waves are labeled to indicate the dominant trend, while corrective sequences show pullback behavior.
It highlights potential entry zones at the start of a new wave and exit zones near completion points.

Guide to Trade with Nelly Elliott Wave Forex Indicator
Buy Rules
- Identify an impulsive wave completing a corrective structure.
- Confirm that the wave count suggests the start of a new bullish phase.
- Enter a buy trade at the opening of the next candle after confirmation.
Sell Rules
- Recognize an impulsive bearish wave following a corrective pullback.
- Ensure price action supports continued downward movement.
- Enter a sell trade at the opening of the next candle after signal confirmation.
Stop Loss
- Place stop loss below the nearest corrective low for buys.
- Place stop loss above the nearest corrective high for sells.
Take Profit
- Set the first take profit at the next wave projection or structural pivot.
- Trail stops as the next wave develops in your favor.
- Exit partially near key Fibonacci resistance or support zones.
- Close the trade if the wave count contradicts your direction.
Practical Tips
- Use the indicator alongside trend analysis to confirm directional bias.
- Avoid trading early in wave sequences that lack clear completion signals.
- Practice reading patterns in different timeframes to build confidence.
- Combine wave signals with support and resistance levels for better timing.
- Be cautious when waves overlap, as counts can be less reliable during choppy periods.
Elliott Wave + Zero-Lag MACD Forex Strategy (MT4)
This Forex strategy combines the Nelly Elliott Wave Forex Indicator for MT4 with the Zero-Lag MACD Indicator for MT4.
Use this combination on timeframes from M5 to H1 to catch short impulsive moves with structure confirmation and momentum alignment.
Why This Strategy Works
Elliott wave patterns help you spot directional structure — waves 1, 2, 3, etc.
When the price is forming a new impulsive wave, it gives you a directional bias.
The Zero-Lag MACD adds momentum confirmation: if the histogram is above zero, it supports bullish impulses; if below, bearish ones.
Together, you get a higher-probability entry when structure and momentum agree.
Buy Entry Rules
- On your chosen timeframe (M5, M15, M30, H1), wait until the Elliott Wave indicator draws a new upward wave leg (for example, wave 3 or wave 5).
- Confirm that the Zero-Lag MACD histogram is above zero (positive), indicating bullish momentum.
- Enter a buy trade at the open of the next candle after both signals align.
- Set your stop loss below the start of the current upward wave (or below the most recent swing low).
- Take profit when the MACD histogram drops below zero (turns negative) or when the Elliott tool indicates a wave structure completion or reversal.
Sell Entry Rules
- Wait for the Elliott Wave indicator to draw or project a downward wave leg via its blue structural lines.
- Confirm that the Zero-Lag MACD histogram is below zero (negative), indicating bearish momentum.
- Enter a sell trade at the open of the next candle after alignment.
- Set stop loss above the start of the current downward wave (or above the recent swing high).
- Take profit when the MACD histogram rises above zero or when the Elliott structure signals a reversal or wave end.
Advantages
- Combines structural pattern analysis (Elliott waves) with momentum confirmation.
- Helps you avoid countertrend entries by requiring agreement between wave structure and MACD momentum.
- Can catch strong impulsive moves early in the wave cycle.
- Clear signals reduce hesitation in fast markets.
- Flexible across several intraday timeframes (M5 to H1).
Drawbacks
- Elliott wave labeling can sometimes lag, or the indicator might misinterpret wave structure.
- In sideways or choppy markets, the MACD histogram may oscillate around zero, producing false triggers.
- The entry might come late into the wave, reducing profit potential.
- Slippage and spread costs can erode gains on short moves, especially on smaller timeframes.
Case Study 1: AUDUSD M15
In the AUDUSD on a 15-minute chart, the Elliott Wave indicator drew a new upward wave leg after a corrective pullback.
The blue structural line projected continuation upward.
At the same time, the Zero-Lag MACD histogram turned positive and climbed above zero, confirming bullish momentum.
A buy order was placed at the next candle’s open, with stop loss under the recent swing low.
Price advanced in an impulsive move, and we exited as soon as the MACD histogram collapsed below zero.
The trade captured about +25 pips in under 30 minutes, showing how structure + momentum alignment yields clean scalps.
Case Study 2: USDCHF M5
On USDCHF in a 5-minute timeframe, the price formed a clear downward wave as identified by the Elliott Wave indicator, which drew a descending blue structural line.
Simultaneously, the Zero-Lag MACD histogram fell below zero, signaling bearish momentum.
We entered a sell trade at the next candle’s open, placing a stop just above the recent swing high.
Price dropped swiftly, and we closed the position when the MACD histogram reversed above zero, netting around +18 pips in 20 minutes.
This setup illustrates how, even on lower timeframes, you can combine structure and momentum to scalp.
Strategy Tips
- Prefer to trade only when the Elliott wave structure is clear (not during ambiguous periods).
- Wait for a decent distance between the wave start and the current price to avoid noise entries.
- Use tighter risk control; consider 1:1 or 1:1.5 reward ratio on quick moves.
- When the MACD histogram hovers around zero, skip trades — look for stronger momentum.
- Monitor only one or two pairs at a time to avoid overtrading.
- Test on pairs with good intraday volatility (majors or liquid crosses) to find what fits your style.
Download Now
Download the “nelly elliot wave.mq4” indicator for Metatrader 4
FAQ
Does the indicator redraw waves after completion?
Once a wave is confirmed based on completed price action, the indicator fixes the count.
It does not repaint past labels once they are established, helping maintain reliable references.
Can the indicator be used alone?
While it offers wave structure insight, combining it with trend, support/resistance, or momentum tools often improves your entries and exits.
Summary
The Nelly Elliott Wave Forex Indicator for MT4 turns traditional wave theory into a practical tool that highlights wave sequences based on price action.
Automatically identifying impulsive and corrective moves helps traders anticipate probable continuation and reversal zones.
This indicator is flexible across multiple timeframes and instruments.
When used with robust risk control and other technical information, it can enhance timing and boost confidence in wave-based trade setups.


