
About the Nice Value Chart Forex Indicator
The Nice Value Chart Forex Indicator is a momentum-based chart tool developed for MetaTrader 4 traders who want deeper insight into market strength.
Unlike arrow-based indicators, this tool appears in a separate sub-window below the main chart, where it displays colored bars that reflect bullish or bearish pressure.
The indicator analyzes price movement and converts momentum shifts into easy-to-read visual bars.
Green bars indicate rising bullish momentum, while orange bars signal increasing bearish momentum.
This makes it easier to judge when buyers or sellers are gaining control of the market.
It is fully customizable, allowing traders to adjust settings such as the number of calculation bars, overbought and oversold levels, alert notifications, and colors.
This flexibility makes it suitable for different trading styles, from scalping to swing trading.
Free Download
Download the “Nice Value Chart 1.0.mq4” indicator for MT4
Key Features
- Displays momentum bars in a separate MT4 sub-window.
- Green bars signal increasing bullish momentum.
- Orange bars signal increasing bearish momentum.
- Fully adjustable settings for trader preferences.
- Includes alert options for momentum changes.
Indicator Chart
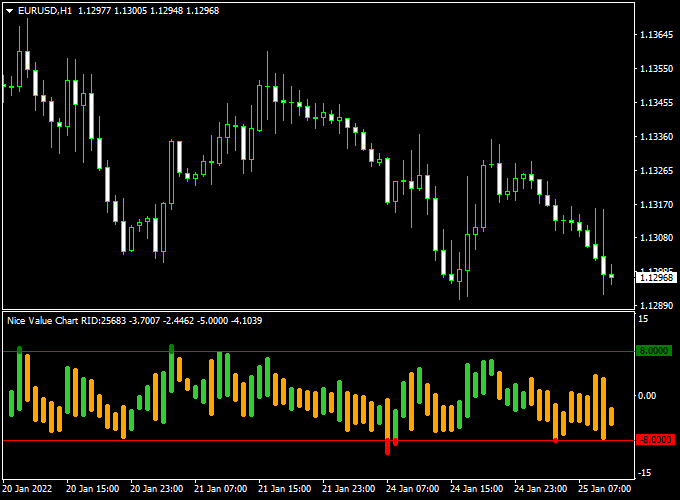
The chart shows the Nice Value Chart Forex Indicator plotted in the lower MT4 window.
Colored bars rise and fall to reflect changes in momentum.
Green bars highlight growing buying pressure, while orange bars highlight strengthening selling pressure.
Traders use these changes to time entries in line with market momentum.
Guide to Trade with Nice Value Chart Forex Indicator
Buy Rules
- Apply the indicator to any preferred currency pair.
- Wait for a green bar to appear in the sub-window.
- Confirm that bullish momentum is increasing.
- Open a buy trade after the signal is established.
Sell Rules
- Ensure the indicator is visible in the lower window.
- Wait for an orange bar to appear.
- Confirm that bearish momentum is building.
- Open a sell trade once the signal stabilizes.
Stop Loss
- Place the stop loss beyond a recent momentum shift level.
- Allow space for normal price fluctuations.
- Adjust the stop size based on the selected timeframe.
Take Profit
- Target nearby support or resistance zones.
- Close trades when momentum bars begin to weaken.
- Scale out of positions during extended moves.
- Adapt profit targets to current market strength.
Nice Value Chart + Buzzer Forex Scalping Strategy (MT4)
This scalping strategy combines the Nice Value Chart Forex Indicator for MT4 with the Buzzer Forex Indicator for MT4.
The Nice Value Chart displays momentum bars in a sub-chart: green bars indicate rising bullish pressure, and orange bars indicate falling bearish pressure.
The Buzzer indicator overlays a green line for buy trends and a red line for sell trends.
By using both indicators together, traders can identify strong short-term moves and scalp efficiently on M1, M5, and M15 timeframes.
Why This Strategy Works
The Nice Value Chart measures immediate momentum shifts, showing when buying or selling pressure is building.
The Buzzer indicator confirms the trend direction.
When both align—green momentum bar with green Buzzer line for buys, or orange bar with red Buzzer line for sells—you get high-probability scalp entries.
This combination reduces false signals and helps traders ride short bursts of intraday momentum.
Buy Entry Rules
- Wait for a green bar on the Nice Value Chart sub-window, indicating rising bullish momentum.
- Confirm that the Buzzer line is green, showing bullish trend direction.
- Enter a buy trade at the open of the next candle after both signals align.
- Set stop loss below the recent swing low or below the low of the last momentum bar.
- Take profit when:
- The Buzzer line turns red, or
- A small pip target is reached (10–20 pips, depending on the timeframe).
Sell Entry Rules
- Wait for an orange bar on the Nice Value Chart, indicating rising bearish momentum.
- Confirm that the Buzzer line is red, showing bearish trend direction.
- Enter a sell trade at the open of the next candle after alignment.
- Set stop loss above the recent swing high or above the high of the last momentum bar.
- Take profit when:
- The Buzzer line turns green, or
- Pip target is achieved (10–20 pips for M1–M5, 20–30 for M15).
Advantages
- Fast, visual signals make entries and exits straightforward for scalpers.
- Combining momentum bars with trend confirmation reduces false entries.
- Works across multiple intraday timeframes.
- Allows precise stop loss placement using recent bars.
- Helps traders capture short bursts of strong intraday movement efficiently.
Drawbacks
- May give false signals in choppy or low-volatility conditions.
- Requires constant monitoring on lower timeframes (M1, M5).
- Spread and slippage can affect returns on very short moves.
- Overtrading is possible if the trader ignores trend alignment.
Case Study 1: EURUSD M5
On the EURUSD 5-minute chart, the Nice Value Chart displayed a green momentum bar while the Buzzer line was green.
A buy trade was executed at the next candle open with a stop loss below the last swing low.
Price quickly advanced, and the trade was closed when the Nice Value Chart bar turned orange, yielding approximately 18 pips within 20 minutes.
Case Study 2: GBPUSD M1
On the GBPUSD 1-minute chart, an orange bar appeared on the Nice Value Chart, and simultaneously, the Buzzer line turned red.
A sell trade was taken on the next candle, with a stop loss above the recent high.
Price fell steadily, and the trade was closed after the Nice Value Chart showed green bars again, capturing around 12 pips in 15 minutes.
Strategy Tips
- Use the strategy during active trading sessions for better momentum and fewer false signals.
- Always confirm both the momentum bar and the Buzzer trend line before entering.
- Adjust pip targets according to the timeframe and volatility.
- Focus on liquid pairs such as EURUSD, GBPUSD, and USDJPY for better price action response.
- Consider scaling out partially when momentum is strong to lock profits early.
- Monitor multiple pairs, but avoid overtrading to preserve discipline.
Download Now
Download the “Nice Value Chart 1.0.mq4” indicator for Metatrader 4
FAQ
Which markets work best with the Nice Value Chart Forex Indicator?
The indicator works well on all major and minor currency pairs, especially those with steady momentum during active trading sessions.
Can the indicator be customized?
Yes, traders can adjust bar calculations, overbought and oversold levels, alerts, and visual colors to match their trading approach.
Is the indicator useful in ranging markets?
In ranging conditions, momentum bars often alternate frequently, which can help traders recognize low-conviction environments.
Does the indicator lag price action?
The indicator is momentum-based, so it reacts after price movement begins, making it more suitable for confirmation rather than prediction.
Summary
The Nice Value Chart Forex Indicator for MT4 provides a reliable way to measure bullish and bearish momentum through visual bar signals.
Its placement in a separate sub-window keeps the main chart clean while delivering valuable market insight.
With extensive customization options and smooth platform performance, the indicator adapts well to different trading styles.
When combined with sound trade management and price confirmation, it can significantly improve timing and confidence in momentum-based trading decisions.


