
About the OHLC Range Forex Indicator
The OHLC Range Forex Indicator is a practical market reference tool developed for MetaTrader 4 traders who focus on daily price behavior.
It displays the Open, High, Low, and Close values for the current trading day directly on the chart.
The indicator appears in the main MT4 chart window and presents all OHLC data in a clear blue format.
This makes it easy to identify today’s active price range without switching timeframes or manually plotting levels.
The OHLC Range indicator is commonly used by intraday traders to track daily boundaries and measure price expansion.
It helps traders understand how far price has moved relative to the day’s open and where potential reaction zones may form.
Free Download
Download the “OHLC_Range.mq4” indicator for MT4
Key Features
- Displays today’s open, high, low, and close prices.
- Information is shown directly on the main chart window.
- Clear blue text for easy visibility.
- Helps track the current daily price range.
- Useful for intraday and session-based trading.
- Compatible with all currency pairs and timeframes.
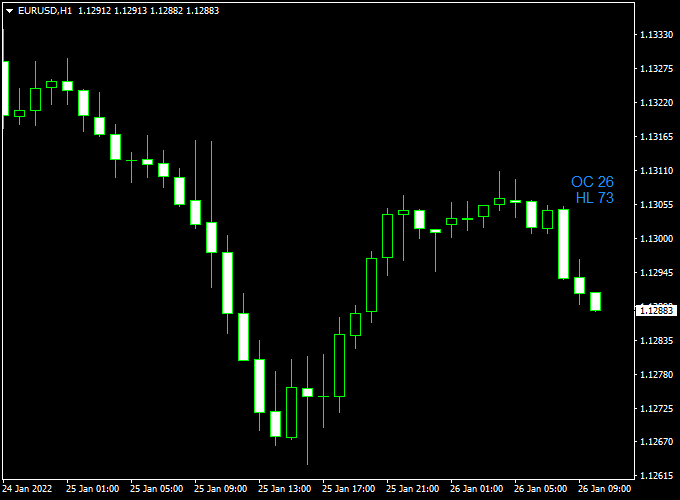
Indicator Chart
The chart shows the OHLC Range Forex Indicator displayed on the main MT4 chart.
Today’s OHLC values are listed clearly on the chart, allowing traders to monitor how price behaves within the daily range.
These levels often act as reference points for intraday reactions and momentum shifts.
Guide to Trade with OHLC Range Forex Indicator
Buy Rules
- Use today’s low as a reference for potential intraday support.
- Wait for bullish price behavior near the lower range.
- Confirm entries using price action or momentum tools.
- Open a buy trade when price holds above the daily low.
Sell Rules
- Use today’s high as a reference for potential resistance.
- Watch for bearish reactions near the upper range.
- Confirm weakness with additional indicators if needed.
- Open a sell trade when price fails to break higher.
Stop Loss
- Place the stop loss outside the current daily range.
- Allow room for normal intraday fluctuations.
- Avoid placing stops exactly on OHLC values.
- Keep trade risk within predefined limits.
Take Profit
- Target the opposite side of the daily range.
- Use the day’s high or low as a logical exit area.
- Secure partial profits during strong directional moves.
- Exit trades if price stalls near key range levels.
OHLC Range Indicator + Directional Breakout MT4 Scalping Strategy
This MT4 scalping method combines the OHLC Range indicator and the Directional Breakout indicator.
OHLC Range helps you see where price has ranged (open, high, low, close), and directional breakout gives momentum confirmation via green (buy) or red (sell) histograms.
By aligning breakout momentum with key price range edges, you can capture fast intraday moves.
This strategy is built for aggressive scalping on short timeframes like M1, M5, or M15.
It works best in volatile pairs (EURUSD, GBPUSD, USDJPY, AUDUSD).
Use during active sessions (London, New York overlap) for better signal quality.
Buy Entry Rules
- Wait until price touches or slightly exceeds the upper boundary of the OHLC Range (today’s high or close range area) — this is your breakout zone.
- The Directional Breakout histogram must turn green (above its breakout threshold), confirming upward momentum.
- Enter a buy at the close of the confirmation candle (the first green bar after the breakout).
- Stop loss: place just below the OHLC Range boundary or below the recent swing low (buffer of 5–10 pips, depending on the pair).
- Take profit: aim for 1:1.5 or 1:2 reward/risk, or exit when the histogram flips red.
Sell Entry Rules
- Wait until price touches or dips below the lower boundary from the OHLC Range (today’s low or close range area) — your breakout zone to the downside.
- The Directional Breakout histogram must turn red (below the negative threshold), confirming downward momentum.
- Enter a sell at the close of that confirmation candle.
- Stop loss: just above the OHLC Range boundary or above the recent swing high (buffer of 5–10 pips).
- Take profit: aim for 1:1.5 or 1:2, or exit when the histogram flips green.
Advantages
- You only trade when the price breaks a key range — reduces random signals.
- Momentum confirmation keeps you in the direction of strong moves.
- Flexible across multiple pairs—just adjust pip buffers and targets.
- Short trades limit exposure to reversals if you act quickly.
Drawbacks
- False breakouts can cause whipsaws, especially in low volume.
- Requires fast execution and discipline — delays hurt profit.
Case Study 1: EURUSD M5
In the early US session, the price rose to touch the OHLC Range’s upper boundary.
At the same time, the Directional Breakout histogram flipped green (exceeding threshold).
A buy was entered at 1.1052.
Stop loss was placed at 1.1042, take profit at 1.1067 (1:1.5).
The move rallied quickly, hitting TP after 15 minutes.
The breakout was clean, and momentum held strong.
Case Study 2: USDJPY M1
During the London session, the price dipped to the lower OHLC Range boundary.
The histogram turned red, confirming downside momentum.
A sell was entered at 149.85, stop at 149.95, target at 149.72.
The price dropped sharply, hitting TP in under 10 minutes before a pullback arrived.
The histogram remained red until close.
Strategy Tips
- Only trade when the spread is low and avoid pairs with wide spreads during off-hours.
- Add a minimum-bar breakout rule: require the breakout candle to close at least a few pips outside the range to filter weak moves.
- Use a small trailing stop once you’re halfway to your target, e.g., trail by 5 pips to lock in profits.
- Backtest on different pairs to find ones with clean OHLC breakout behavior (e.g., EURUSD, GBPUSD, AUDUSD).
- Cap the number of trades per hour to avoid overtrading in noisy conditions.
Download Now
Download the “OHLC_Range.mq4” indicator for Metatrader 4
FAQ
What is the main purpose of the OHLC Range indicator?
It helps traders track today’s price boundaries and understand how price behaves within the current daily range.
Does the indicator update in real time?
Yes, the values update as price moves throughout the trading day.
Can this indicator be used for scalping?
Yes, many scalpers use daily range levels to plan short-term entries and exits.
Summary
The OHLC Range Forex Indicator for MT4 provides traders with immediate access to today’s key price levels directly on the chart.
Displaying the open, high, low, and close of the current session simplifies daily market analysis.
Its ability to highlight the active price range makes it especially useful for intraday decision-making and trade management.
When combined with sound execution and confirmation tools, the indicator can enhance timing and market awareness.


