
About the Pipnailer Signals Dashboard Indicator
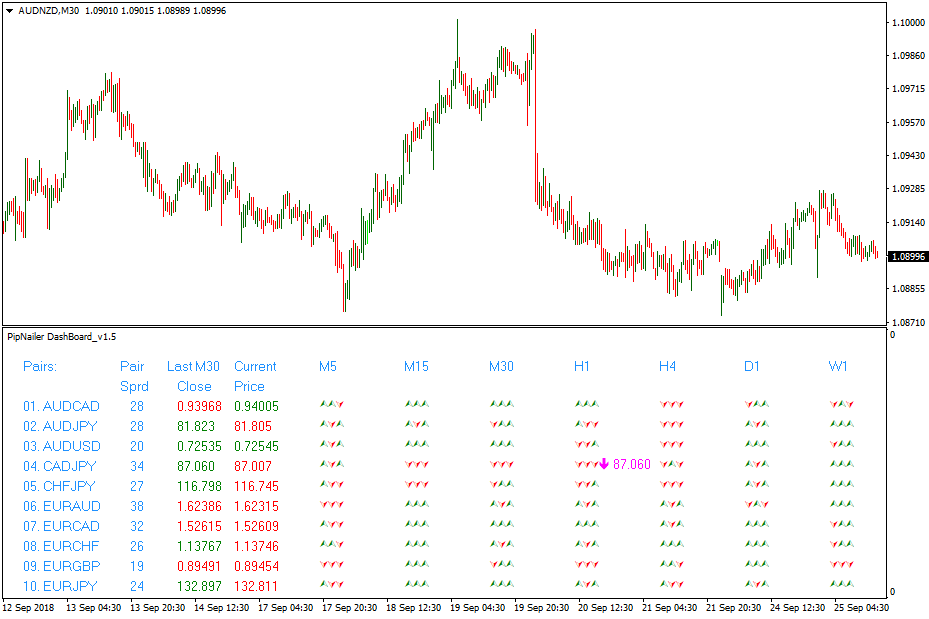
The Pipnailer Signals Dashboard MT4 forex indicator displays buy and sell trade arrows for multiple currency pairs and timeframes in a single, easy-to-read dashboard.
It allows traders to monitor several instruments at once, making it ideal for scalping, day trading, and multi-pair strategies.
The dashboard provides a clear visual of market trends, allowing quick decisions without constantly switching charts.
The indicator shows three green symbols when the trend is up, triggering a buy arrow for the relevant pair and timeframe.
Conversely, three red symbols indicate a downtrend and trigger a sell arrow.
Users can customize which currency pairs or other financial symbols appear on the dashboard directly from the inputs tab.
Pipnailer supports all key timeframes from M5 to W1, displaying the current spread and price for each instrument.
Free Download
Download the “pipnailer-dashboard.mq4” MT4 indicator
Key Features
- Multi-pair dashboard showing buy and sell arrows for any selected symbols.
- Three green symbols indicate an uptrend, three red symbols indicate a downtrend.
- Supports timeframes from M5, M15, M30, H1, H4, D1, W1.
- Displays current spread and price for all pairs.
- Fully customizable symbols and timeframes from the indicator’s inputs tab.
- Ideal for scalping, intraday trading, and monitoring multiple instruments at once.
Indicator Chart
The Pipnailer chart shows up and down arrows for selected currency pairs across multiple timeframes.
Green arrows indicate bullish conditions, while red arrows indicate bearish conditions.
The dashboard allows traders to spot trends and trading opportunities instantly, making it easier to plan entries and exits efficiently.
Guide to Trade with Pipnailer Signals Dashboard
Buy Rules
- Open a buy trade when the dashboard displays an up arrow for the chosen currency pair and timeframe.
- Confirm trend direction using an additional trend-following indicator if desired.
- Avoid buying if multiple pairs are showing conflicting trends.
- Consider liquidity and session activity to ensure higher probability trades.
Sell Rules
- Open a sell trade when the dashboard displays a down arrow for the chosen currency pair and timeframe.
- Confirm downward momentum using trend or volume indicators.
- Avoid selling if other correlated pairs show an uptrend.
- Focus on active trading sessions for clearer trend signals.
Stop Loss
- Place a stop loss just below a nearby support zone for buy trades.
- Place a stop loss just above a nearby resistance zone for sell trades.
- Consider tightening the stop progressively once the trade moves favorably to lock in profits.
Take Profit
- Close buy trades when the dashboard shows a down arrow or price reaches the next resistance level.
- Close sell trades when the dashboard shows an up arrow or price reaches the next support level.
- Optionally use trailing take profit to follow the trend for larger moves.
- Use high-volume session highs and lows as alternative exit points to maximize gains.
PipNailer and Renko Trend Catching Forex Strategy for MT4
This strategy combines the trend-identifying power of Renko charts with the precise trade signals from the PipNailer Signals Dashboard.
The goal is to filter out market noise and provide clear entry points for traders following established trends.
It is designed for the Metatrader 4 platform and works best on timeframes from 15 minutes to 4 hours, suitable for both day and swing traders.
The PipNailer Signals Dashboard acts as the primary trade trigger, while the Renko Boxes Forex Indicator serves as a confirmation filter, smoothing price action and helping traders avoid choppy or uncertain markets.
Buy Entry Rules
- Wait for the PipNailer dashboard to display a clear up arrow for your currency pair and timeframe.
- Check the Renko Boxes indicator; ensure blue boxes are forming, indicating a buying trend.
- Enter a buy trade only when both the PipNailer signal and the Renko trend confirm upward movement.
- Place stop loss below the most recent swing low or last red Renko box.
- Set take profit at least twice the distance of your stop loss, or hold until Renko boxes turn red.
Sell Entry Rules
- Wait for the PipNailer dashboard to display a down arrow for your currency pair and timeframe.
- Confirm the Renko Boxes indicator shows red boxes, signaling a selling trend.
- Enter a sell trade only when both signals align.
- Set stop loss above the recent swing high or last blue Renko box.
- Target a take profit level double your risk, or exit manually if Renko boxes turn blue.
Advantages
- Filters out random market noise effectively since Renko bricks only form with meaningful price moves.
- Prevents trading against the trend by requiring confirmation from two sources.
- Visual signals are clear, reducing guesswork and subjective interpretation.
- Supports consistent risk management; stop loss levels are clearly defined by market structure.
Drawbacks
- Renko charts may lag slightly during fast-moving news events.
- False signals can occur in prolonged sideways consolidation periods.
- Requires patience; trades are only taken when both indicators align perfectly.
Case Study 1: EURUSD Buy Trade
On the EURUSD 30-minute chart, the market had been ranging.
The PipNailer dashboard displayed an up arrow, while the Renko Boxes formed a blue box, confirming upward momentum.
Entering at 1.1050 with a stop loss at 1.1030 and a take profit at 1.1090 resulted in a smooth trend upward, achieving the 1:2 risk-reward target.
Case Study 2: GBPJPY Sell Trade
On the GBPJPY 1-hour chart, the PipNailer showed a down arrow.
The Renko Boxes indicated red, confirming a downtrend.
A sell entry at 155.20, stop loss at 155.50, and take profit at 154.60 captured the downward move as the red Renko boxes continued forming, resulting in a profitable trade.
Strategy Tips
- Use proper money management: risk only a small percentage of your account per trade (1–2%).
- Confirm trend alignment: always trade in the direction of the Renko trend and the PipNailer signal together.
- Filter trades by session: the London and New York sessions typically offer the best trend movements and liquidity.
- Set realistic stop loss and take profit levels based on recent swing highs/lows and Renko structure.
- Use multiple confirmations, such as support/resistance zones, alongside signals for higher probability trades.
- Be patient; wait for both indicators to align rather than chasing signals.
- Backtest and demo test the strategy extensively before trading live.
Download Now
Download the “pipnailer-dashboard.mq4” Metatrader 4 indicator
FAQ
Can Pipnailer monitor multiple currency pairs at once?
Yes, the dashboard allows you to track multiple pairs simultaneously.
You can add or remove symbols directly from the inputs tab.
Which timeframes are supported?
Pipnailer supports M5, M15, M30, H1, H4, D1, and W1.
Traders can select any timeframe that suits their trading style.
Do I need additional indicators to trade Pipnailer signals?
No, the dashboard can be used standalone.
However, combining it with trend or volume indicators can improve trade accuracy.
Summary
The Pipnailer Signals Dashboard indicator provides a clear overview of multiple currency pairs and timeframes, generating buy and sell arrows to simplify trade decisions.
Its multi-pair functionality and easy-to-read dashboard make it ideal for scalpers and day traders.
The indicator can be used alone or with trend-following tools for confirmation.
It helps traders monitor spreads, price, and trend direction simultaneously, enhancing efficiency, entry timing, and risk management across multiple instruments.


