About the Point & Figure Charts Indicator
The Point & Figure Charts Indicator for MT4 brings a classic charting method directly into the Metatrader 4 platform.
Unlike traditional candlestick or bar charts, Point and Figure charts focus solely on price movement and completely ignore time.
This approach helps traders concentrate on meaningful price changes rather than short-term fluctuations.
The indicator builds columns of price movement using fixed box sizes and reversal rules.
Only when price moves enough to justify a new box or reversal does the chart update.
As a result, market noise is filtered out, making trends, breakouts, and consolidation zones easier to recognize.
Point & Figure charts are commonly used to identify support and resistance, trend direction, and breakout opportunities.
Free Download
Download the “Point figure.mq4” indicator for MT4
Key Features
- Displays Point & Figure price movement directly on the chart.
- Removes the time component from market analysis.
- Highlights directional movement using colored bars.
- Filters out minor price fluctuations and market noise.
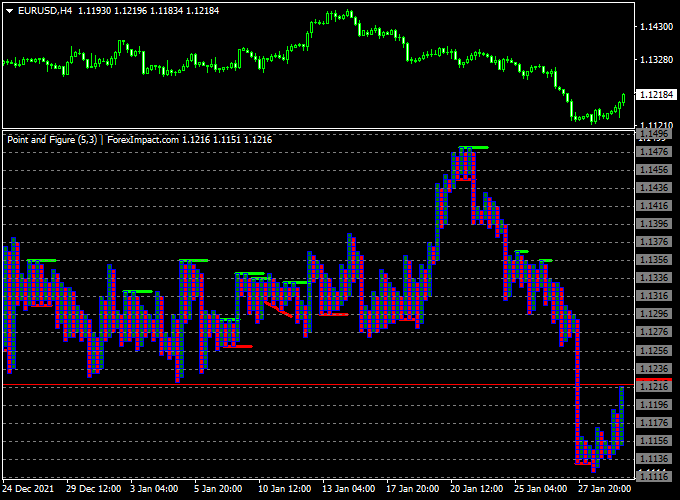
Indicator Chart
The Point & Figure Charts Indicator is displayed in the main chart window using colored price columns.
The chart shows directional price movement through blue and magenta bars.
These bars help traders quickly identify breakouts, trend continuation, and shifts in market pressure.

Guide to Trade with the Point & Figure Charts Indicator
Buy Rules
- Wait for the Point & Figure chart to paint a blue bar.
- Confirm the move reflects price strength or an upside breakout.
Sell Rules
- Wait for the Point & Figure chart to show a magenta bar.
- Confirm the move reflects price weakness or a downside breakout.
Stop Loss
- Place the stop loss beyond the most recent Point & Figure reversal.
Take Profit
- Target previous congestion zones or measured price moves.
- Trail the stop as new bars form in your favor.
Point & Figure Chart + Awesome Oscillator Forex Day Trading Strategy
This day trading strategy consists of the Point & Figure Charts Indicator, which displays a blue and magenta bar-style point and figure graph in a subchart.
And the Awesome Forex Indicator uses a histogram above zero to indicate bullish momentum and below zero to indicate bearish momentum.
Together, these two tools help identify clean intraday price reversals and momentum shifts.
The Point & Figure chart filters noise by focusing on price movement rather than time, while the Awesome Oscillator confirms the underlying strength of that movement.
This combination works best for 5-minute and 15-minute charts during active trading sessions, such as the London or New York overlap.
Buy Entry Rules
- Wait for the Point & Figure chart to paint a blue bar, signaling an upward breakout or price strength.
- Check that the Awesome Oscillator histogram is above the zero line, confirming bullish momentum.
- Enter a buy trade at the close of the candle when both conditions align.
- Place a stop loss just below the most recent swing low or at the base of the last magenta bar on the Point & Figure chart.
- Set a take profit at least 1.5× to 2× the size of the stop loss.
- Alternatively, you can exit when the Point & Figure chart turns magenta or the Awesome Oscillator crosses below zero.
Sell Entry Rules
- Wait for the Point & Figure chart to show a magenta bar, indicating a downward move or price weakness.
- Confirm that the Awesome Oscillator histogram is below the zero line, showing bearish momentum.
- Enter a sell trade at the close of the candle when both signals align.
- Place a stop loss a few pips above the recent swing high or the top of the last blue bar.
- Set a take profit at 1.5× to 2× your stop distance, or exit if the Point & Figure chart turns blue or the Awesome Oscillator crosses above zero.
Advantages
- Filters out intraday market noise using the Point & Figure chart’s price-based structure.
- Awesome Oscillator confirms momentum, avoiding false reversals.
- Works well in trending and breakout conditions on short time frames.
- Simple to read: both indicators give clear visual confirmation for entry.
- Helps traders stay on the right side of the trend by combining direction and strength.
Drawbacks
- Sideways markets may produce mixed signals and false starts.
- Signals can sometimes appear after part of the move has already happened.
- Point & Figure’s delayed update can cause late entries on strong reversals.
- Requires patience and discipline to wait for clean alignment between both tools.
Example Case Study 1 – AUD/USD on M15
During the Asian session, AUD/USD consolidated near 0.6620.
As the London session opened, the Point & Figure chart printed a blue bar, signaling potential upward movement.
The Awesome Oscillator also crossed above zero.
A buy trade was entered at 0.6625 with a stop loss 10 pips below.
Over the next 40 minutes, the pair climbed steadily to 0.6645, hitting a 20-pip take profit for a 2:1 risk-reward win.
The Awesome Oscillator stayed above zero throughout the trade, confirming sustained momentum.
Example Case Study 2 – EUR/JPY on M5
In the early New York session, EUR/JPY was trading around 159.00.
The Point & Figure chart turned magenta, and the Awesome Oscillator dropped below zero.
A sell trade was triggered at 158.95 with a 12-pip stop loss above the last swing high.
The pair fell to 158.70 within 25 minutes, yielding a 25-pip profit.
The magenta bars and negative oscillator reading kept the bias clear until the exit point.
Strategy Tips
- Use this strategy only during high-volume hours for smoother moves and less noise.
- Combine with key support and resistance zones to filter out weaker signals.
- Avoid trading during major economic news releases, which can distort oscillator readings.
- Adjust the Point & Figure box size to suit volatility—smaller boxes for scalping, larger for stable trends.
- Trail your stop behind new swing highs/lows as the move develops to lock in profit.
Download Now
Download the “Point figure.mq4” indicator for Metatrader 4
FAQ
Why do Point & Figure charts ignore time?
The method focuses exclusively on price movement.
This helps traders avoid reacting to insignificant fluctuations caused by time-based volatility.
Is the indicator suitable for trend trading?
Yes, Point & Figure charts are well known for highlighting sustained directional moves.
They make trend strength and reversals easier to interpret.
Can the indicator be used alongside candlestick charts?
Yes, many traders use it as a confirmation tool.
It complements time-based charts by offering a different market perspective.
Does the indicator repaint past bars?
No, once a Point & Figure bar is confirmed, it remains fixed.
This allows for reliable analysis and historical review.
Summary
The Point & Figure Charts Indicator for MT4 offers traders a disciplined way to analyze price without time-based distractions.
By filtering out minor movements, it highlights the underlying structure of the market.
Its visual simplicity makes it easier to spot breakouts, trends, and key price levels.
The indicator integrates well with both discretionary and systematic trading approaches.
While it requires a shift in perspective compared to traditional charts, the Point & Figure method rewards patience and consistency.
Used correctly, this indicator can help traders improve focus, timing, and confidence in market decisions.


