
About the Powerful ATR Buy Sell Indicator
The Powerful ATR Buy Sell Indicator for MetaTrader 4 is a volatility-based trend tool that converts Average True Range data into actionable trading signals.
The indicator uses ATR calculations to identify when price movement has enough strength to support directional trades.
The indicator plots a color-coded histogram below the main trading chart.
Blue histogram bars indicate bullish volatility conditions, while red bars reflect bearish volatility.
This format allows traders to quickly recognize trend direction supported by the market range.
Its default parameters are optimized for most market environments, allowing traders to focus on execution rather than constant adjustment.
It can be traded on its own or combined with oscillators or price action tools.
Free Download
Download the “iATR_Advanced_Histo_v1.0.ex4” MT4 indicator
Key Features
- ATR-based histogram trend indicator.
- Blue bars signal bullish volatility.
- Red bars signal bearish volatility.
- Works across all currency pairs.
- Compatible with all MT4 timeframes.
- Suitable for multiple trading styles.
Indicator Chart
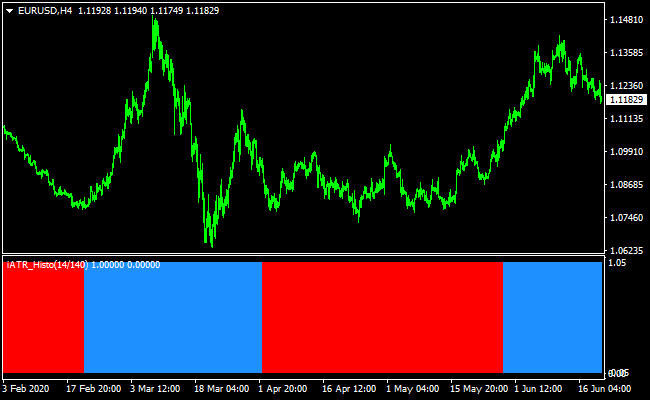
The chart below shows the Powerful ATR Buy Sell Indicator applied to a forex chart.
The histogram alternates between blue and red as volatility shifts direction.
The first color change often signals the start of a new trend phase, helping traders align entries with momentum.
Guide to Trade with Powerful ATR Buy Sell Indicator
Buy Rules
- The ATR histogram changes color from red to blue.
- Market volatility supports bullish continuation.
- Price is trading above recent consolidation.
- Enter the trade at the close of the signal candle.
Sell Rules
- The ATR histogram changes color from blue to red.
- Market volatility supports bearish continuation.
- Price is trading below recent consolidation.
- Enter the trade at the close of the signal candle.
Stop Loss
- Set the stop loss using 1 to 1.5 times the current ATR value.
- Place stops beyond the recent swing structure.
- Reduce position size when using wider stops.
Take Profit
- Target a minimum reward-to-risk ratio of 2:1.
- Trail the stop loss as long as the histogram remains the same color.
- Exit the trade when volatility begins to contract.
Powerful ATR + Trend Predictor MT4 Day-Trading Strategy
This MT4 strategy uses the trend strength from the Powerful ATR Buy/Sell Forex Signal indicator together with precise entry arrows from the Trend Predictor v1.0.
The ATR-based histogram gives you a sense of the current volatility-based trend: blue for bullish conditions, red for bearish conditions.
The Trend Predictor overlays clearer entry arrows: blue for buy, red for sell. By combining them, you only enter trades when both the trend strength and entry direction agree.
This approach is ideal for day traders who want to capture intraday swings but avoid purely noise-driven entries.
It is most effective on M15 and H1 charts, where there is enough room for ATR-driven moves, but you remain responsive to intraday momentum.
This strategy works particularly well in active sessions (such as London or New York), when volatility is high enough to make ATR reliable.
Buy Entry Rules
- The ATR histogram must turn blue, indicating a bullish trend.
- The Trend Predictor must display a blue arrow, signaling a buy entry.
- Enter a long position when both conditions appear on the same or very close candles.
- Set a stop loss below the most recent swing low or a reasonable ATR-based buffer (for example, 1–1.5 × the current ATR).
- Set your take profit around 1.2–1.8 × your stop distance, depending on how strong the ATR reading is and how much momentum you see developing.
Sell Entry Rules
- The ATR histogram must turn red, indicating a bearish trend.
- The Trend Predictor must show a red arrow, signaling a sell entry.
- Enter a short position when both conditions line up.
- Place your stop loss above the recent swing high or use an ATR-based buffer (e.g., 1–1.5 × ATR).
- Set take profit at around 1.2–1.8 × the stop loss distance, adjusted by volatility.
Advantages
- The ATR histogram gives a volatility-adjusted trend filter, helping you avoid weak trend trades.
- The Trend Predictor arrow provides clear, timely entry signals.
- You only take trades when both trend strength and entry alignment agree, reducing false entries.
- Suitable for intraday trading with meaningful room for profit without holding overnight.
- Allows flexible stop-loss sizing based on ATR, making risk management more adaptive.
Drawbacks
- On very low volatility days, ATR may be too flat, reducing signal generation.
- During sudden spikes (news), arrows may lag or the trend may shift rapidly.
- Stop losses based on ATR can be relatively wide, which may eat into small day-trade gains if not managed carefully.
- Not ideal for traders who prefer very tight scalping targets; this is more swing-within-day oriented.
Example Case Study 1: EUR/USD on M15
During the London session, EUR/USD began to build a steady up move.
The ATR histogram turned blue, indicating growing volatility in the bullish direction.
At the same time, the Trend Predictor formed a blue arrow. A buy entry was taken.
The stop loss was placed just under the recent swing low, but with a little space to account for ATR-based volatility.
Price drifted upward with momentum and hit the take-profit target at roughly 1.5 × the stop loss after a couple of strong bars.
Example Case Study 2: USD/JPY on H1
Later in the New York session, USD/JPY reversed downward.
The ATR histogram switched to red, signifying a shift in volatility toward sellers.
The Trend Predictor then printed a red arrow, confirming a bearish entry.
A short trade was opened, stop loss above a recent swing high using an ATR buffer, and take profit set to about 1.5 times that distance.
Over the next few hours, the pair moved down steadily, and the TP was hit before the price consolidated again.
Strategy Tips
- Use major, liquid pairs like EUR/USD, USD/JPY, or GBP/USD to ensure ATR is meaningful.
- Avoid taking signals right before major economic news that may disrupt ATR-based volatility readings.
- Backtest different ATR multipliers for stop-loss and take-profit to find what works best for your risk tolerance.
- If the ATR histogram turns color but the arrow does not appear, wait patiently — do not force a trade.
- Consider using trailing stop logic once the trade moves in your favor, especially when ATR remains large.
- Track your trades and refine the strategy over time, adjusting TP/SL ratios based on average ATR sizes for your chosen pairs.
Download Now
Download the “iATR_Advanced_Histo_v1.0.ex4” Metatrader 4 indicator
FAQ
Why use ATR for trend direction instead of volatility only?
This indicator converts volatility into directional bias, helping traders avoid entering markets that lack follow-through.
Does the indicator perform better during active sessions?
Yes, it tends to perform best during high-liquidity sessions where volatility expansion is more consistent.
Can this indicator be combined with support and resistance?
Yes, aligning ATR signals with key levels often improves entry accuracy and trade management.
Summary
The Powerful ATR Buy Sell Indicator for MT4 provides traders with clear trend direction based on market volatility rather than price alone.
By converting ATR data into a color-changing histogram, it becomes easier to identify when momentum is shifting.
This indicator adapts well to different trading styles and timeframes, making it suitable for scalpers, day traders, and swing traders alike.
When combined with sound trade planning and consistent execution, it can be a valuable tool for confirming volatility-driven trends.


