About the Powertrend Indicator
The Powertrend indicator for MT4 is a trend-following Forex indicator built around the Average True Range.
It focuses on identifying sustained directional moves rather than short-term price noise.
By using ATR calculations, the indicator adapts to changing market volatility and adjusts its signals accordingly.
Once applied to the chart, Powertrend draws colored trading lines directly on price.
Blue lines indicate bullish market conditions, while red lines signal bearish pressure.
The default ATR period is set to 3, making the indicator responsive to short-term changes.
Traders can adjust this value to make the signals smoother or more reactive depending on their trading style.
Free Download
Download the “bat-atr.mq4” MT4 indicator
Key Features
- ATR-based trend detection.
- Colored buy and sell lines plotted directly on the price chart.
- Adjustable ATR period for signal sensitivity.
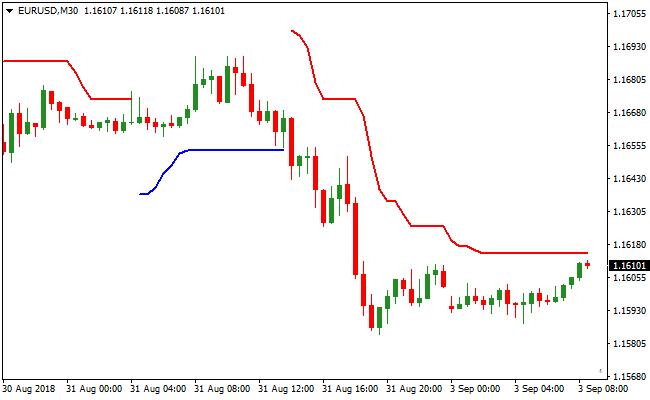
Indicator Chart
The Powertrend indicator displays colored lines following price movement.
Blue lines trail price during upward trends, while red lines track price during downward trends.
These lines help traders visually follow trend direction and potential entry points.

Guide to Trade with the Powertrend Indicator
Buy Rules
- Enter a buy trade when a blue Powertrend line first appears on the chart.
- Confirm that price remains above the blue line after it forms.
- Focus on buy setups when consecutive blue lines continue to print.
- Avoid buy trades if the line frequently changes color.
Sell Rules
- Enter a sell trade when a red Powertrend line first appears on the chart.
- Confirm that price remains below the red line after it forms.
- Favor sell setups when red lines continue without interruption.
- Avoid sell trades during choppy, sideways price action.
Stop Loss
- For buy trades, place the stop loss 2-3 pips below the most recent swing low.
- For sell trades, place the stop loss 2-3 pips above the most recent swing high.
Take Profit
- For buy trades, exit when the indicator switches from blue to red.
- For sell trades, exit when the indicator switches from red to blue.
PowerTrend and SMA Crossover Signal MT4 Forex Strategy
This MT4 forex strategy combines the trend-following PowerTrend MT4 Forex Indicator with the precise trend confirmation from the SMA Crossover Signal MT4 Forex Indicator.
It is designed for M5, M15, and H1 charts, making it suitable for both short-term and intraday trades.
The strategy is ideal for traders who want clear visual cues for entry and exit while staying aligned with the dominant trend.
The PowerTrend indicator uses a colored line to indicate trend direction.
A blue line signals a buy opportunity, while a red line signals a sell opportunity.
The SMA Crossover Signal indicator provides additional trend confirmation with arrows.
A green arrow indicates a buy trend, while a red arrow indicates a sell trend.
Using both indicators together ensures that trades are aligned with the prevailing trend and supported by a secondary confirmation signal.
This strategy works best on major currency pairs and gold during active market sessions and helps traders capture high-probability moves efficiently.
Buy Entry Rules
- The PowerTrend line must be blue, indicating a bullish trend.
- Check the SMA Crossover Signal indicator for a green arrow confirming the trend.
- Enter a buy trade at the close of the candle where both indicators align.
- Place the stop loss below the most recent swing low or minor support level.
- Keep the trade open while the PowerTrend line remains blue and no red arrow appears.
- Close the trade immediately if the PowerTrend line turns red or a red arrow appears.
Sell Entry Rules
- The PowerTrend line must be red, indicating a bearish trend.
- Check the SMA Crossover Signal indicator for a red arrow confirming the trend.
- Enter a sell trade at the close of the candle where both indicators align.
- Place the stop loss above the most recent swing high or minor resistance level.
- Keep the trade open while the PowerTrend line remains red and no green arrow appears.
- Close the trade immediately if the PowerTrend line turns blue or a green arrow appears.
Advantages
- Combines trend-following and confirmation signals for higher probability trades.
- Trades are easy to spot on M5, M15, and H1 charts thanks to the clear signals from both indicators.
- Reduces the risk of entering countertrend trades by requiring dual indicator alignment.
- Flexible for both scalping and intraday trading depending on the chosen timeframe.
- Works on multiple currency pairs and gold without complicated settings.
Drawbacks
- Requires monitoring multiple timeframes to ensure proper trend alignment.
- Trend reversals can trigger early exits during choppy price action.
- Intraday spikes or news events can occasionally hit stop losses prematurely.
Case Study 1
On EURUSD M5 during the London session, the PowerTrend line turned blue, signaling a bullish trend.
The SMA Crossover Signal indicator displayed a green arrow after a minor retracement.
A buy trade was entered and held while both indicators remained aligned.
When the PowerTrend line turned red, the trade was closed for a profit of 27 pips, capturing a strong intraday upward move.
Case Study 2
On GBPJPY M15 during the New York session, the PowerTrend line turned red, indicating a bearish trend.
The SMA Crossover Signal indicator produced a red arrow following a brief consolidation.
A sell trade was opened and maintained while both indicators confirmed the downtrend.
When the PowerTrend line switched to blue, the trade was closed, securing a gain of 54 pips from the intraday move.
Case Study 3
On USDCHF H1 during the European session, the PowerTrend line turned blue, confirming a bullish trend.
The SMA Crossover Signal indicator showed a green arrow shortly after a small pullback.
A buy trade was entered and held as long as both indicators remained aligned.
When the PowerTrend line turned red, the trade was closed for 41 pips, capturing a solid intraday upward move.
Strategy Tips
- Only take trades when both the PowerTrend line and the SMA Crossover arrow are aligned to increase the probability of success.
- Use M5 charts for quick scalping, M15 for slightly longer intraday moves, and H1 to capture more extended trends.
- Focus on major currency pairs and gold during high-liquidity sessions to ensure stronger and more reliable price movements.
- Place stop losses near recent swing highs or lows to protect your trades from sudden reversals.
- Close trades immediately if the PowerTrend line changes color or the SMA Crossover arrow reverses to preserve profits.
- Wait for minor pullbacks before entering a trade to improve timing and reduce the risk of entering at overextended levels.
- Keep a trading journal to track which pairs, timeframes, and session hours work best with this strategy for continuous improvement.
- Consider scaling out partial positions as trades move in your favor to lock in profits while letting the remainder run with the trend.
- Always follow proper money management rules and avoid overleveraging to protect your account during unexpected market moves.
Download Now
Download the “bat-atr.mq4” Metatrader 4 indicator
FAQ
How does ATR influence the Powertrend signals?
ATR measures market volatility. When volatility increases, the Powertrend lines adjust to avoid premature trend changes and reduce false signals.
Is Powertrend better suited for trending markets?
Yes, the indicator performs best when the market is trending. In sideways conditions, frequent color changes may occur.
Can the ATR period be customized for different strategies?
Lower ATR values make the indicator more sensitive, while higher values smooth the signals and suit longer-term trading approaches.
Summary
The Powertrend indicator offers a straightforward way to follow market trends using ATR-based logic.
Its color-coded lines make trend identification fast and intuitive across all trading environments.
With adjustable sensitivity and compatibility across all timeframes, Powertrend fits a wide range of trading styles.
It is especially useful for traders who prefer clean, trend-focused charts without indicator clutter.


