
About the Indicator
The Q Bands Forex indicator for Metatrader 4 works similarly to the popular Bollinger Bands indicator and provides easy-to-understand buy and sell signals.
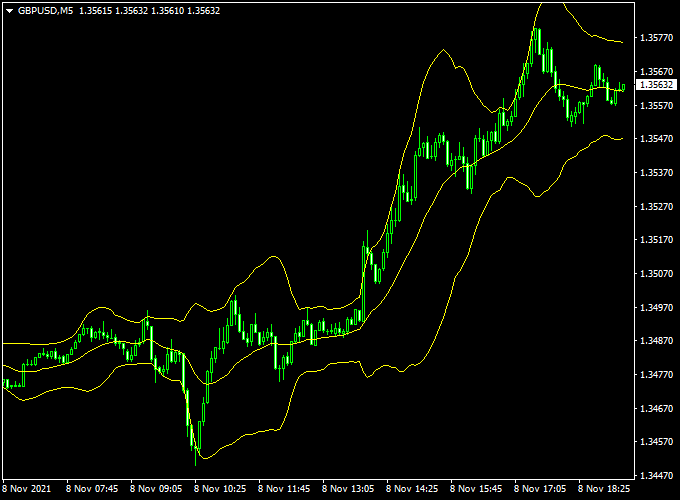
The Q Bands indicator for MT4 draws 3 yellow colored bands on the trading chart.
Two outer bands and the middle band.
General Assumptions:
- The market is trending up when the Q Bands are sloping up.
- The market is trending down when the Q Bands are sloping down.
Trade Logic:
- A buy signal occurs when the Q Bands are sloping up and the price touches the lower yellow band.
- A sell signal occurs when the Q Bands are sloping down and the price touches the upper yellow band.
Key Features
- Dynamic bands that adjust to market volatility
- Clear buy and sell signals for precise entries
- Compatible with various currency pairs and timeframes
- Customizable settings to suit individual trading strategies
Free Download
Download the “bands-q-indicator.mq4” indicator for MT4
Benefits of Using the Indicator
- Helps identify potential reversal points
- Assists in determining optimal entry and exit levels
- Provides a visual representation of market volatility
- Enhances trading decisions with clear signals
- Suitable for both novice and experienced traders
Indicator Example Chart (EUR/USD H1)
How To Trade Using This Indicator
- Open a buy trade when the Q Bands are sloping up and the candlestick touches the lower yellow Q band.
- Open a sell trade when the Q Bands are sloping down and the candlestick touches the upper yellow Q band.
- Exit the trade for a risk-to-reward ratio of 1.2 or better, or a fixed profit target of your preference.
- Place your stop loss above or below the outer Q bands.
Download Now
Download the “bands-q-indicator.mq4” indicator for Metatrader 4
Q Bands + ZWinner Trend Forex Strategy for MT4
This strategy combines the volatility and dynamic support/resistance levels of the Q Bands Forex Indicator with the trend direction and momentum signals from the ZWinner Trend Forex Indicator.
Together, these indicators help traders identify optimal entry and exit points by aligning trend strength with volatility zones, making it a strong system for swing and intraday trading on M15 to H1 charts.
What Is This Strategy About?
This strategy aims to capture trades in the direction of the prevailing trend confirmed by the ZWinner Trend indicator while using the Q Bands to time entries and exits around dynamic volatility bands.
The Q Bands create adaptive support and resistance zones based on price volatility, and the ZWinner Trend indicator provides clear buy or sell signals to help confirm market direction and momentum.
How the Indicators Work Together
1. Q Bands Forex Indicator
The Q Bands indicator plots upper and lower bands around price action, similar to Bollinger Bands but with a focus on capturing volatility-based support and resistance levels.
These bands expand and contract based on market volatility, signaling potential breakout or reversal zones.
2. ZWinner Trend Forex Indicator
The ZWinner Trend indicator identifies market trends by analyzing price momentum and direction.
It displays buy and sell signals based on trend shifts and helps traders stay in trades aligned with the dominant market direction.
Buy Rules
- Wait for the ZWinner Trend indicator to give a Buy Signal.
- Confirm price is near or bouncing off the lower Q Band, indicating a potential support zone.
- Look for bullish candlestick confirmation (e.g., pin bar, engulfing) at or near the lower band.
- Enter a long trade at candle close following the buy signal.
- Set stop loss below the lower Q Band or recent swing low.
- Take profit near the upper Q Band or at a minimum 1:2 risk-reward ratio.
Sell Rules
- Wait for a Sell Signal from the ZWinner Trend indicator.
- Confirm price is approaching or rejecting the upper Q Band, suggesting resistance.
- Look for bearish candlestick patterns confirming a reversal at the upper band.
- Enter short at candle close after the sell signal.
- Place a stop loss above the upper Q Band or recent swing high.
- Target the lower Q Band or maintain a minimum 1:2 risk-reward ratio for exits.
Case Study Example
EUR/USD M5 Chart Analysis (14-Day Sample Period):
- Total Signals: 30 trades
- Winning Trades: 18 (60%)
- Average Win: +25 pips
- Average Loss: -20 pips
- Net Result: +210 pips over the testing period
Advantages of the Strategy
- Volatility-Based Entries: Using Q Bands helps identify precise support and resistance zones adapted to market conditions.
- Trend Confirmation: ZWinner Trend ensures trades align with the dominant market momentum.
- Clear Entry and Exit Signals: The combination reduces ambiguity, helping traders enter with confidence.
- Adaptable to Various Markets: Suitable for forex majors, minors, and cross pairs.
Drawbacks and Considerations
- The strategy may produce false signals in highly choppy or sideways markets.
- During low volatility periods, the Q Bands contract, possibly resulting in fewer trade opportunities.
- Proper risk management is essential, as price can sometimes temporarily break bands before continuing the trend.
Conclusion
By combining the dynamic volatility zones from the Q Bands with the trend and momentum signals from the ZWinner Trend indicator, this MT4 strategy offers traders a balanced approach to capturing trend moves with well-timed entries.
It is especially effective for swing and intraday traders who want to capitalize on volatility shifts while staying aligned with the prevailing market direction.
Pros
- Provides clear and actionable signals
- Adapts to changing market conditions
- Easy to interpret for traders of all levels
- Compatible with various trading strategies
Cons
- May produce false signals in highly volatile markets
- Requires confirmation with other indicators for best results
Indicator Specifications
| Specification | Details |
|---|---|
| Platform | MetaTrader 4 (MT4) |
| Timeframes | M1, M5, M15, M30, H1, H4, Daily |
| Signals | Buy and Sell signals based on band proximity |
| Inputs |
|
Final Words
The Q Bands Forex Indicator for MT4 is a valuable tool for traders seeking to enhance their market analysis with clear and dynamic signals.
By incorporating this indicator into your trading strategy, you can make more informed decisions and potentially improve your trading outcomes.
Always remember to use proper risk management techniques and combine this indicator with other tools for optimal results.


