About the Quantile Bands Forex Indicator
The Quantile Bands Forex indicator for Metatrader 4 is designed to track price movement within a dynamic range that adapts to changing market conditions.
Instead of relying on fixed volatility levels, it uses quantile calculations to map where price currently sits within its recent distribution.
This approach helps traders better understand when the market is leaning bullish or bearish.
The indicator is displayed directly on the main chart as a multi-band channel that follows price action closely.
As market sentiment shifts, the bands adjust and reflect the new balance between buyers and sellers.
Color changes in the central band act as a directional guide and help traders stay aligned with the dominant trend.
Quantile Bands are well suited for trend traders who prefer simple and responsive tools.
Free Download
Download the “quantile-bands.mq4” indicator for MT4
Key Features
- A trend-following channel plotted directly on the price chart.
- Adaptive bands that react to changing market behavior.
- Color-changing middle band to indicate trend direction.
- Supports both trade entries and exits.
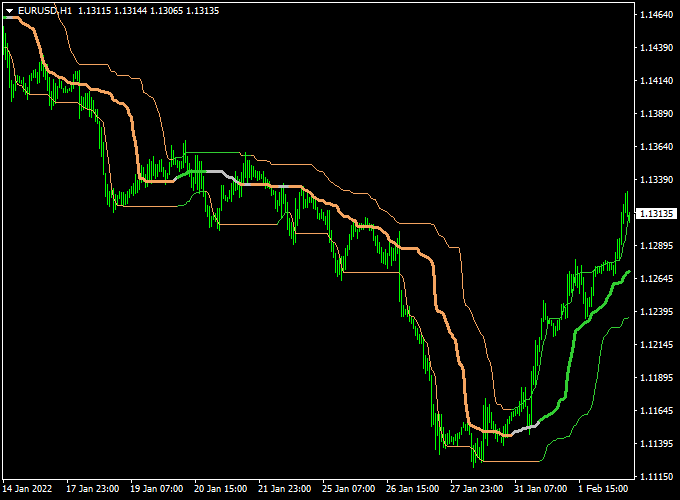
Indicator Chart
The Quantile Bands Forex indicator chart displays a price channel surrounding market action.
The outer bands help visualize price extremes within the current trend.
The middle band changes color to reflect bullish or bearish conditions.
This layout helps traders identify trend direction and potential pullback zones.

Guide to Trade with Quantile Bands Forex Indicator
Buy Rules
- Wait for the middle band to turn green.
- Confirm that the price is holding above the middle band.
- Enter a buy trade after bullish price confirmation.
Sell Rules
- Wait for the middle band to turn brown.
- Confirm that the price is holding below the middle band.
- Enter a sell trade after bearish price confirmation.
Stop Loss
- Place the stop loss beyond the opposite outer band.
- For buy trades, set it below recent channel support.
- For sell trades, set it above recent channel resistance.
Take Profit
- Target the next significant price reaction zone.
- Use a fixed pip objective that suits the selected time frame.
- Exit the trade when the middle band changes color.
Quantile Bands + Best Forex Scalping Indicator MT4 Scalping Strategy
This scalping strategy blends the trend‑detection power of the Quantile Bands Forex Indicator with the signal precision of the Best Forex Scalping Indicator.
The Quantile Bands show trend direction by the slope of their bands (upwards = bullish, downwards = bearish).
The Best Scalping Indicator gives entry arrows: blue for buy, red for sell.
Together, they aim to capture quick intraday moves with trend alignment and clean entries.
Use this method mostly on fast timeframes like M5 or M15, and preferably on pairs with tight spreads and good volatility (such as EUR/USD, GBP/USD, USD/JPY, AUD/USD).
The logic: trade only in the direction of the band slope and use the arrow signals as timing triggers.
Buy Entry Rules
- Check that the Quantile Bands slope is upward (bands rising), indicating a bullish trend.
- Wait for a blue arrow from the Best Forex Scalping Indicator.
- Enter a buy trade at the close of the candle with the blue arrow (if the quantile bands’ slope is still upward).
- Place a stop loss just below the recent swing low or just under the lower band.
- Set a target of 15–25 pips or trail stop as the price moves in your favor.
- Alternatively, exit when a red arrow appears or bands flatten/turn downward.
Sell Entry Rules
- Confirm that the Quantile Bands slope downward (bands falling), signaling a bearish trend.
- Wait for a red arrow from the Best Forex Scalping Indicator.
- Enter a sell trade at the close of the candle with the red arrow (if band slope is still downward).
- Place a stop loss just above the recent swing high or just above the upper band.
- Target 15–25 pips or trail stop as price moves downward.
- Exit the trade if a blue arrow appears or bands flatten or slope up.
Advantages
- Combines trend direction (bands) with precise entry signals (arrows) for better filtered trades.
- Reduces false entries by requiring both trend and signal confirmation.
- Works in multiple currency pairs where the price respects volatility bands.
- Allows for clear exits (arrow reversal or band slope change) so the strategy is easier to manage.
- Helpful for traders who prefer quick decisions—no need to guess direction, you wait for the arrow + slope alignment.
Drawbacks
- In sideways or ranging markets, band slope may be flat or indecisive, causing many ignored or false signals.
- Sometimes arrows may appear slightly late relative to band slope change, reducing reward potential.
- Slippage and spread may reduce effective profitability when aiming for small pip targets.
- Frequent signal reversals in choppy markets can lead to small losses stacking up.
- Trend reversals can happen quickly; band slope may lag slightly, causing the indicator to give delayed signals.
Example Case Study 1 – EUR/USD
On the 5-minute chart, the Quantile Bands showed a steadily upward slope from 1.1080 to 1.1100.
A blue arrow was printed at 1.1092.
Because the bands were still rising, a buy was entered at 1.1095, a stop loss was placed at 1.1085, and a target was set at 1.1115 (20 pips).
The price climbed and hit the target within the London session for +20 pips.
Example Case Study 2 – GBP/JPY
On the 15-minute chart during the New York session, the quantile bands began sloping downward.
A red arrow showed at 191.20.
A sell entry was taken at 191.18, stop loss at 191.38, and target at 190.98 (20 pips).
The price fell and hit the target within a couple of hours, capturing +20 pips.
Strategy Tips
- Trade only when the band slope is clear and strong—avoid trades when bands are nearly flat.
- Prefer pairs with tight spreads and good liquidity during active sessions.
- Use arrows only as confirmation; never trade an arrow if it goes against the band slope direction.
- If a trade moves favorably by half your target, consider moving the stop to breakeven or trailing it just outside the band.
- Backtest on your preferred pair(s) to understand how arrow timing lags slope changes and adjust pip targets accordingly.
- Limit the number of trades per session to avoid overtrading in low volatility periods.
- Consider using additional confirmation, like volume, or a secondary indicator (e.g., RSI or momentum) when in doubt.
Download Now
Download the “quantile-bands.mq4” indicator for Metatrader 4
FAQ
What makes Quantile Bands different from standard channels?
Quantile Bands adapt based on price distribution rather than fixed calculations.
This allows the channel to respond more naturally to changing volatility.
Does the indicator work well during strong trends?
Yes, it is designed to follow sustained directional movement.
Trending conditions usually produce the most consistent results.
Can the indicator help with trade exits?
Yes, color changes in the middle band can be used as exit signals.
The outer bands also guide profit-taking zones.
Summary
The Quantile Bands Forex indicator for MT4 helps traders stay focused on market direction without unnecessary complexity.
Its adaptive channel follows price behavior and adjusts as conditions evolve.
This makes it easier to remain in trades that align with the prevailing trend.
The color change of the middle band offers a practical way to assess bullish and bearish phases.
Traders can use this information to time entries with greater confidence.
The outer bands provide additional reference points for managing risk and reward.
Quantile Bands are suitable for a wide range of trading styles and time frames.
The indicator performs best when combined with disciplined trade management.
With consistent use, it can support more structured and confident trend-based decisions.


