
About the Rainbow Arrows V1 Indicator
The Rainbow Arrows V1 Indicator is a trend trading tool built for MetaTrader 4 traders who prefer direct and easy-to-read signals.
It follows the broader market direction and plots buy and sell arrows directly on the main price chart.
This approach allows traders to react quickly without relying on multiple indicators or complex calculations.
A green arrow represents a buy signal and appears when bullish momentum aligns with the overall trend.
A red arrow represents a sell signal and appears when bearish pressure dominates the market.
Instead of generating only one entry per trend, the indicator continues to deliver additional arrows as long as the trend remains active.
This makes Rainbow Arrows V1 especially useful for traders who scale into trends or look for multiple entries during strong price movements.
Several settings can be adjusted from the inputs tab, allowing traders to fine-tune signal sensitivity and adapt the indicator to different pairs or timeframes.
Free Download
Download the “RainbowArrows_V1.ex4” MT4 indicator
Key Features
- Buy and sell arrows plotted directly on the trading chart.
- Green arrows indicate bullish trade opportunities.
- Red arrows highlight bearish trade setups.
- Follows the overall market trend for higher probability trades.
- Provides multiple signals during sustained trends.
- Customizable parameters through the inputs tab.
Indicator Chart
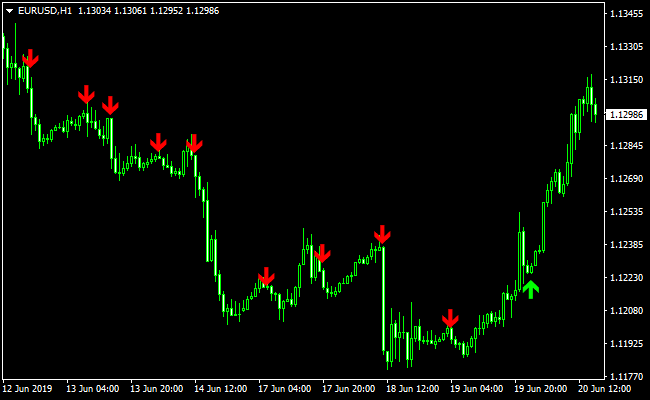
The Rainbow Arrows V1 Indicator chart displays colored arrows aligned with the dominant trend.
Green arrows appear below price during uptrends, while red arrows appear above price during downtrends.
This visual setup helps traders quickly identify entry points and stay engaged during strong market moves.
Guide to Trade with Rainbow Arrows V1
Buy Rules
- Wait for a green arrow to appear on the chart.
- Confirm that recent price action is making higher highs.
- Avoid entries against strong resistance levels.
- Enter a buy trade at the close of the signal candle.
Sell Rules
- Wait for a red arrow to appear on the chart.
- Confirm that price is forming lower lows.
- Avoid selling directly into major support zones.
- Enter a sell trade at the close of the signal candle.
Stop Loss
- Place the stop loss a few pips below the last bullish candle for buy trades.
- Place the stop loss a few pips above the last bearish candle for sell trades.
- Widen the stop slightly during high volatility sessions.
Take Profit
- Target previous swing highs or lows as profit objectives.
- Scale out partial profits on each new arrow in trend direction.
- Use a trailing stop once price moves favorably.
- Exit fully when an opposite arrow appears.
Rainbow Arrows + Zwinner Trend Intraday Forex Strategy (MT4)
This intraday strategy combines the Rainbow Arrows V1 with the Zwinner Trend Indicator.
The Rainbow Arrows indicator plots green arrows for buy signals and red arrows for sell signals.
The Zwinner Trend shows a histogram: green bars denote a bullish trend, red bars denote a bearish trend.
By using both tools, you gain both signal timing and trend confirmation to take more reliable intraday trades on M15 and H1 charts.
This strategy is suited for day traders who want clear trend alignment plus good entry points.
It works particularly well during active sessions like London and New York on pairs that offer decent volatility, such as EUR/USD, GBP/JPY, and USD/CAD.
Using both indicators helps to avoid counter-trend trades and gives more confidence to hold intraday positions.
Buy Entry Rules
- On the M15 or H1 chart, check that the Zwinner Trend histogram is green, indicating an uptrend.
- Wait for a green arrow from the Rainbow Arrows indicator.
- Enter a long trade at the close of the candle with the green arrow, but only if the Zwinner histogram stays green.
- Place the stop loss below the recent swing low, or a few pips under the arrow candle.
- Take profit: for M15 aim for 20‑40 pips, for H1 you can target 40‑80 pips depending on market action.
- If the Zwinner histogram begins to turn red or weakens, consider closing part or all of the position.
Sell Entry Rules
- Make sure the Zwinner Trend histogram is red, signaling a downtrend.
- Wait for a red arrow from the Rainbow Arrows indicator.
- Open a short position at the close of the candle that shows the red arrow, provided the Zwinner histogram remains red.
- Place a stop loss above the recent swing high or just above the arrow candle.
- Set a take profit: for M15, aim for 20‑40 pips; for H1, 40‑80 pips is reasonable, depending on pair and volatility.
- You may exit early (or scale out) if the Zwinner histogram weakens or turns green.
Advantages
- The trend filter from Zwinner Trend helps you stay with the prevailing market direction.
- Rainbow Arrows give precise entry signals, which improve timing.
- The strategy works well on both M15 and H1, offering flexibility for faster or slower intraday trades.
- Reasonable risk‑reward potential when targets are aligned with trend strength.
- You can adjust the profit target according to intraday volatility.
Drawbacks
- Arrows can appear slightly after strong momentum begins, causing delayed entries.
- The Zwinner histogram may lag or flip late, especially when the trend shifts quickly.
- Trades might be fewer because you only take entries when both indicators agree.
Case Study 1
On EUR/JPY (M15) during the London session, the Zwinner Trend histogram turned green and held steady for several bars.
A green arrow from the Rainbow Arrows indicator then appeared on a pullback candle.
The trader entered long at the close of that candle, placing a stop loss just under the swing low.
Price rallied strongly, climbing around 35 pips in the next hour.
The Zwinner histogram remained green for most of the move, confirming to hold until the target of 40 pips was reached.
Case Study 2
On GBP/USD (H1) in the New York session, the Zwinner Trend histogram turned red, showing a clear bearish trend.
The Rainbow Arrows indicator printed a red arrow after a small consolidation.
The trader went short at the close of that candle, with a stop loss above the recent swing high.
Over the next few hours, GBP/USD dropped about 60 pips.
The red histogram bars stayed in place long enough to give confidence, allowing the trader to ride most of the move before taking profit.
Strategy Tips
- Use pairs that have decent intraday range; avoid pairs that are too slow or too erratic.
- Always check that Zwinner Trend confirms the direction before taking an arrow signal.
- Consider scaling out: close half at an early target and let the rest run as long as the trend remains strong.
- Be ready to exit early if the histogram fluctuates or reverses color to protect profits.
- Backtest the strategy on different currency pairs to see which ones it performs best with on M15 and H1.
Download Now
Download the “RainbowArrows_V1.ex4” Metatrader 4 indicator
FAQ
Why does Rainbow Arrows V1 generate multiple signals in one trend?
The indicator is designed to follow trend continuation rather than single-entry logic.
As long as market conditions remain aligned with the trend, it continues to provide fresh entry opportunities.
This helps traders maximize strong directional moves.
Which timeframes work best with Rainbow Arrows V1?
The indicator performs well on M5, M15, M30, and H1 charts.
Higher timeframes tend to produce fewer but more reliable arrows, while lower timeframes offer more frequent signals.
Can the indicator settings be adjusted?
Yes, several parameters can be modified from the inputs tab.
Adjusting sensitivity allows traders to control how often arrows appear and how closely they follow price.
Is Rainbow Arrows V1 suitable for ranging markets?
The indicator is optimized for trending conditions.
In sideways markets, signals may appear closer together and require additional confirmation from price action.
Summary
The Rainbow Arrows V1 Indicator is a solid choice for forex traders who focus on trend continuation and repeated entry opportunities.
Its arrow-based signals are easy to interpret and reduce the need for constant chart analysis.
With adjustable settings, consistent signal logic, and the ability to capitalize on strong trends, this indicator fits well into a disciplined trading plan.


