About the Rainbow Bars Forex Signal Indicator
The Rainbow Bars Forex Signal indicator for MT4 is designed to simplify trend trading by turning price action into an easy-to-read visual format.
It uses a layered rainbow-style approach combined with colored candlesticks to reflect market direction in real time.
Instead of relying on complex calculations, the indicator focuses on showing whether buyers or sellers are in control.
A central reference line plays a key role in defining bullish and bearish conditions.
When price interacts with this line, the indicator reacts quickly and adjusts the candle colors accordingly.
This allows traders to stay aligned with the dominant trend without overanalyzing the chart.
Free Download
Download the “rainbow bars.mq4” indicator for MT4
Key Features
- Rainbow-style trend layout that reflects shifting market conditions.
- Dynamic candle coloring that mirrors bullish and bearish pressure.
- Central trend line used as a reference for directional bias.
- Suitable for discretionary and rule-based trading approaches.
- Adapts well to different time frames and volatility environments.
Indicator Chart
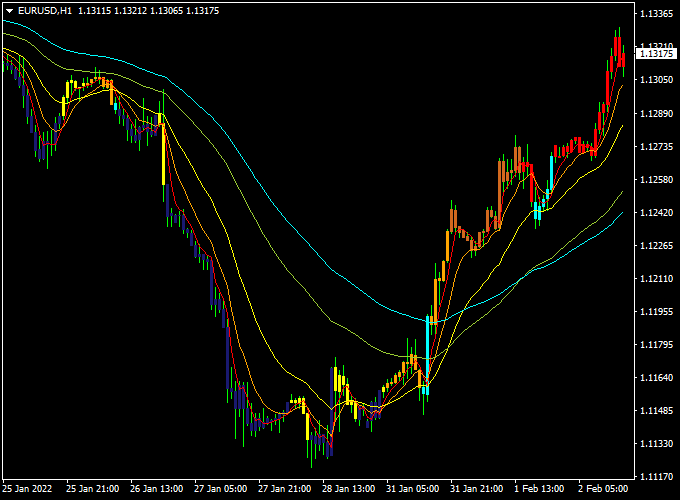
The Rainbow Bars Forex Signal indicator appears on the main MT4 chart as colored candles and a guiding trend line.
The chart highlights bullish and bearish phases through color changes.
Price interaction with the reference line helps traders identify potential trend continuation or early shifts in direction.

Guide to Trade with the Rainbow Bars Forex Signal Indicator
Buy Rules
- Observe the market until price stabilizes above the guiding trend line.
- Make sure consecutive candles maintain bullish coloring.
- Enter the buy trade once momentum shows steady upward follow-through.
Sell Rules
- Wait for the price to remain below the trend line without immediate rejection.
- Confirm that candles consistently display bearish colors.
- Open the sell trade when downward pressure is sustained.
Stop Loss
- Position the stop loss outside the recent consolidation area.
- Allow room for minor pullbacks while protecting capital.
Take Profit
- Secure profits near prior highs or lows visible on the chart.
- Trail the stop as long as candle colors support the open trade.
- Exit manually if price action loses directional strength.
Rainbow Bars + EW Trend MT4 Scalping Strategy
This scalping strategy combines the trend detection of the Rainbow Bars Forex Signal Indicator with the quick entry signals from the EW Trend Indicator for Scalping.
The Rainbow Bars indicator identifies trend direction when the price crosses the blue line, upwards for bullish and downwards for bearish.
The EW Trend Indicator signals short-term entries: crossing above 0.00 for buy, and below 0.00 for sell.
Using both ensures that trades follow the prevailing trend with confirmed entry points.
This strategy is most effective on 5-minute and 15-minute charts during active trading sessions, particularly in London and New York.
It works well on high-liquidity pairs like EUR/USD, GBP/JPY, and USD/CHF.
Buy Entry Rules
- Confirm that the price crosses above the Rainbow Bars blue line from below (bullish trend).
- Wait for the EW Trend Indicator to jump above the 0.00 level.
- Enter a buy trade at the close of the confirmation candle.
- Place a stop loss 10–15 pips below the recent swing low or below the blue line.
- Take profit 20–30 pips, or exit when the EW Trend crosses back below 0.00 or price closes below the blue line.
Sell Entry Rules
- Confirm that the price crosses below the Rainbow Bars’ blue line from above (bearish trend).
- Wait for the EW Trend Indicator to jump below the 0.00 level.
- Enter a sell trade at the close of the confirmation candle.
- Set a stop loss 10–15 pips above the recent swing high or above the blue line.
- Take profit 20–30 pips, or exit when the EW Trend crosses back above 0.00 or price closes above the blue line.
Advantages
- Combines trend-following with precise scalping entry signals.
- Works on multiple pairs with strong intraday moves.
- Suitable for short-term trading sessions, allowing quick profits.
- Helps avoid counter-trend trades by confirming trend direction first.
Drawbacks
- Rapid price movements can trigger early or false signals, especially on low timeframes.
- Whipsaw trades may occur when the price hovers around the blue line, causing quick reversals.
- Strategy performance may decline during low-volume periods or holidays.
- Requires discipline to avoid taking trades against the main trend indicated by the Rainbow Bars.
Example Case Study 1 – EUR/USD
On the 5-minute chart, price crossed above the Rainbow Bars blue line at 1.1052.
The EW Trend Indicator jumped above 0.00.
A buy trade was entered at 1.1055, stop loss at 1.1042, and take profit at 1.1075.
The trade reached the target within 25 minutes, yielding +20 pips.
Example Case Study 2 – GBP/JPY
During the New York session, the price crossed below the Rainbow Bars’ blue line at 191.60.
The EW Trend Indicator jumped below 0.00.
A sell trade was entered at 191.58, stop loss at 191.75, and take profit at 191.28.
The trade reached the target within 35 minutes, yielding +30 pips.
Strategy Tips
- Only trade when the trend and EW Trend confirmation fully align; avoid partial signals.
- Consider using additional support/resistance levels to strengthen entry and exit decisions.
- Focus on pairs with low spreads to maximize scalping profitability.
- Use trailing stops to capture extended moves while protecting capital.
- Avoid overtrading; limit to 2–4 high-probability trades per session.
- Check for market conditions—avoid trading during sideways consolidation or very thin liquidity periods.
- Backtest the strategy on different pairs to determine which respond best to trend and EW Trend signals.
- Keep a trading journal to track patterns, success rates, and adjust pip targets based on volatility.
Download Now
Download the “rainbow bars.mq4” indicator for Metatrader 4
FAQ
How should the Rainbow Bars indicator be configured for best results?
The default settings work well in most market conditions.
Minor adjustments can be made to suit different time frames or volatility levels.
Is Rainbow Bars more effective in trending or ranging markets?
The indicator performs best when the market shows steady directional movement.
Sideways conditions may produce fewer reliable signals.
Can this indicator help with trade re-entry?
Yes, repeated color alignment after a pullback can highlight opportunities to rejoin the trend.
This is especially useful during strong market phases.
Does Rainbow Bars require additional confirmation tools?
It can be used on its own, but combining it with basic market context often improves consistency.
Simple trend filters can enhance trade selection.
Summary
The Rainbow Bars Forex Signal indicator for MT4 provides a straightforward way to read market direction.
Its color-based approach allows traders to react to trend changes without clutter.
The indicator suits traders who value simplicity and fast interpretation.
It adapts well across multiple markets and time frames.
With proper risk management and patience, Rainbow Bars can support disciplined trend trading and more confident decision-making.


