
About the Relative Strength Index Forex Indicator
The Relative Strength Index Forex Indicator for MT4 is a classic momentum oscillator that remains one of the most effective ways to gauge market sentiment.
It operates by comparing the average gains and losses over a specific period to determine if a pair is currently overvalued or undervalued.
This indicator is unique because it quantifies market psychology into a single, easy-to-read line.
RSI (Relative Strength Index) for Metatrader 4 is one of the most used indicators in Forex for identifying overbought and oversold market conditions.
One of the main benefits of this system is its ability to highlight divergences that are not visible on a standard price chart.
When price makes a new high but the RSI does not, it often signals a looming trend reversal.
By using the Relative Strength Index Forex Indicator, you eliminate the guesswork involved in identifying market tops and bottoms.
It provides a systematic approach to the markets, ensuring that you enter trades only when the momentum is in your favor.
Free Download
Download the “Relative strength index.mq4” indicator for MT4
Key Features
- The indicator pops up a separate MT4 chart window as a colored RSI signal line that moves between 0 and 100.
- It features adjustable level markers, typically set at 70 and 30, to define extreme market zones.
- The tool calculates momentum shifts in real-time without lagging behind significant price action.
- It can be used to identify trend strength by observing if the line stays above or below the 50-level midpoint.
- The settings can be tweaked to be more sensitive for scalping or smoother for long-term position trading.
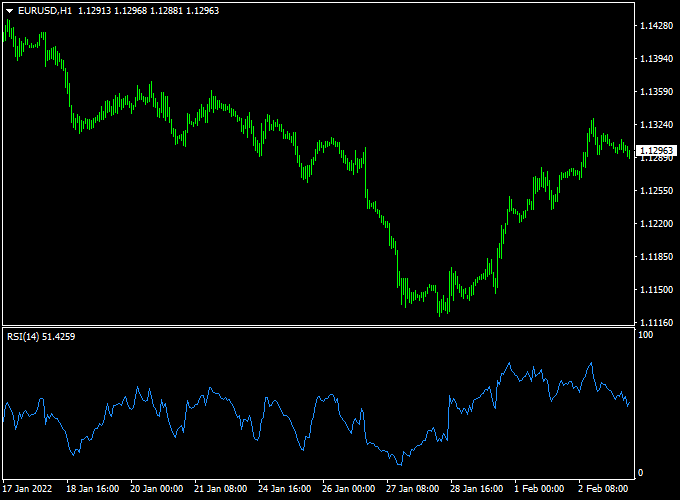
Indicator Chart
The Relative Strength Index Forex Indicator chart features a fluctuating line that oscillates within a bounded range.
When the line crosses above the upper threshold, it visualizes a market that may be due for a correction.
Conversely, when the line dips below the lower threshold, it shows that sellers may be losing steam.
Guide to Trade with Relative Strength Index Forex Indicator
To achieve the best results with this tool, follow these specific trading rules.
Buy Rules
- Wait for the RSI signal line to drop below the 30 level into the oversold zone.
- Watch for the line to hook back upward and cross back above the 30 mark.
- Open a buy position if the price action shows a bullish candlestick pattern simultaneously.
- RSI delivers the best trading results when combined with a trend trading indicator or price action methods.
Sell Rules
- Wait for the RSI signal line to rise above the 70 level into the overbought zone.
- Observe the line as it turns downward and crosses back below the 70 mark.
- Open a sell position once the momentum shift is confirmed by a bearish candle.
- Ensure the higher timeframe trend supports a move to the downside.
Stop Loss
- For buy trades, place the stop loss below the most recent swing low formed during the oversold period.
- For sell trades, place the stop loss above the recent swing high formed in the overbought zone.
- Maintain a disciplined approach to risk management on every trade.
Take Profit
- Exit the trade when the RSI line reaches the opposite extreme level.
- Alternatively, take profits when the RSI line touches the 50-level midpoint for a more conservative target.
- You can also use fixed reward ratios based on the volatility of the specific pair.
RSI + Super Signal Bands MT4 Scalping Strategy
This scalping strategy combines the Relative Strength Index (RSI) MT4 Indicator with the Super Signal Bands MT4 Indicator.
By blending momentum analysis and trend confirmation, this strategy allows traders to enter short-term trades with high probability.
It works best on 1-minute to 15-minute charts, making it ideal for scalpers seeking multiple intraday opportunities.
How It Works
The RSI identifies overbought and oversold conditions.
Readings above 70 suggest the market is overbought and may reverse downwards, while readings below 30 indicate an oversold market and potential upward reversal.
The Super Signal Bands help confirm the trend.
The green line signals a buy trend, and the orange line signals a sell trend.
Combining these tools ensures trades align with both momentum and trend direction.
Buy Entry Rules
- RSI reading is below 30, indicating oversold conditions
- Super Signal Bands show a green line confirming a buy trend
- Enter a buy trade at the next candle after both conditions are met
- Stop loss placed just below the most recent swing low
- Take profit set at 10–20 pips or a 1:1.5 risk-to-reward ratio
Sell Entry Rules
- RSI reading is above 70, indicating overbought conditions
- Super Signal Bands show an orange line confirming a sell trend
- Enter a sell trade at the next candle after both conditions are met
- Stop loss placed just above the most recent swing high
- Take profit set at 10–20 pips or a 1:1.5 risk-to-reward ratio
Advantages
- Clear entry and exit rules make scalping fast and structured
- Combines trend confirmation and momentum to reduce false signals
- Works on short time frames for quick intraday profits
- Simple visual cues from RSI and Super Signal Bands improve decision-making
- Flexible risk management with small stop losses
Drawbacks
- Not suitable for highly volatile news sessions due to quick reversals
- Can generate false signals in sideways or ranging markets
- Requires constant monitoring of the chart during trading hours
- Small pip targets require discipline and fast execution
Case Study 1
On the EUR/USD 5-minute chart, the RSI dropped to 28, signaling oversold conditions.
Simultaneously, the Super Signal Bands displayed a green line confirming an upward trend.
A buy trade was entered at 1.0952, with a stop loss at 1.0940 and a take profit at 1.0962.
The trade captured 10 pips in under 15 minutes, illustrating how quickly scalping opportunities can be seized when momentum and trend align.
Case Study 2
On the GBP/USD 1-minute chart, RSI reached 72, indicating overbought conditions.
The Super Signal Bands showed an orange line confirming a sell trend.
A sell trade was opened at 1.2345, stop loss at 1.2355, and take profit at 1.2335.
The trade captured 10 pips within 8 minutes, showing the effectiveness of combining RSI extremes with trend confirmation for short-term profits.
Strategy Tips
- Always check the Super Signal Bands before taking RSI signals to ensure trend alignment
- Use small position sizes since pip targets are short
- Focus on high liquidity currency pairs to avoid slippage
- Avoid trading around major news releases that can cause spikes
- Keep a trading log to track performance and refine timing
Download Now
Download the “Relative strength index.mq4” indicator for Metatrader 4
FAQ
What is the difference between an RSI 14 and an RSI 7 setting?
The standard 14-period setting provides a balanced view of momentum and is less prone to market noise.
A shorter 7-period setting makes the Relative Strength Index Forex Indicator much more reactive, causing it to reach overbought or oversold levels more frequently.
Scalpers often prefer shorter periods, while swing traders typically stick to the default values.
How do I read RSI readings over 70 and below 30?
RSI readings over 70 indicate overbought conditions, suggesting the price may have risen too fast and could pull back.
RSI readings below 30 indicate oversold market conditions, suggesting the price has dropped significantly and a bounce might be coming.
These levels serve as alerts to look for potential trade setups.
Can the RSI stay in overbought or oversold zones for a long time?
Yes, during a very strong trend, the RSI can remain above 70 or below 30 for extended periods.
This is why professional traders rarely use the RSI in isolation.
It is important to wait for the line to actually exit the extreme zone before assuming a reversal has begun.
Summary
The Relative Strength Index for MT4 is an effective momentum oscillator that assists in determining the appropriate timing for market entries.
By calculating the ratio of upward to downward moves, it offers a quantitative view of price strength.
This tool helps traders maintain a disciplined routine by highlighting levels where the market is statistically likely to stall or reverse.
Using this indicator allows you to filter high-risk trades that occur at the peak of exhausted moves.
If you are looking for a reliable way to improve your trade accuracy, you can use the Relative Strength Index Forex Indicator to enhance your strategy.


