
About the Resistance Trend Line Forex Indicator
The Resistance Trend Line Forex Indicator for Metatrader 4 is a practical tool for tracking recent resistance levels in the market.
It analyzes price action and draws the most recent resistance trend line directly on the chart, giving traders a visual reference for trade planning and risk management.
Displayed as a red line in the main MT4 chart window, the indicator highlights areas where price may encounter resistance.
Short-term traders, including scalpers and day traders, can use this line to place stop losses on sell trades or identify breakout opportunities for buy trades.
The Resistance Trend Line indicator works across all MT4 symbols and timeframes, making it versatile for multiple trading styles.
It can be used alone or combined with trend and momentum indicators to improve trading accuracy.
Free Download
Download the “LineFrakUp.mq4” indicator for MT4
Key Features
- Automatically draws the most recent resistance trend line
- The red line provides a clear visual reference for price resistance
- Useful for stop loss placement and breakout trade planning
- Applicable to all MT4 symbols and timeframes
- Supports day trading, scalping, and short-term strategies
Indicator Chart
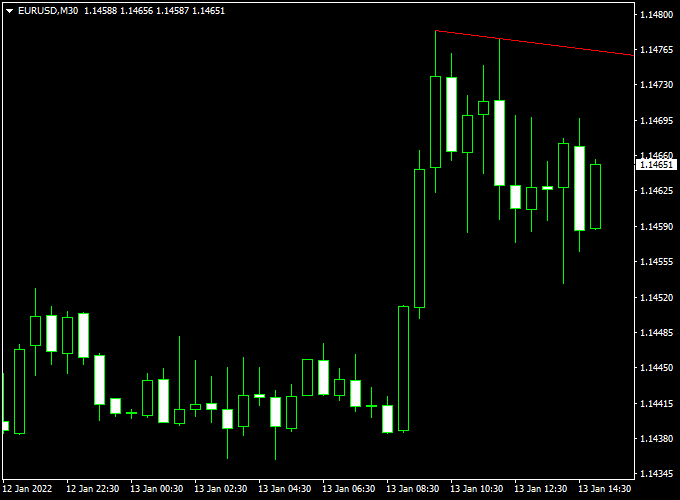
The chart example shows the Resistance Trend Line Forex Indicator applied to an MT4 chart.
The red line marks the most recent resistance trend, helping traders determine entry points, stop loss placement, and breakout trade opportunities.
Guide to Trade with Resistance Trend Line Forex Indicator
Buy Rules
- Enter a buy trade if the candlestick breaks above the resistance trend line
- Ensure the breakout is supported by a strong bullish candle formation
- Consider waiting for a close above the line to reduce false breakouts
Sell Rules
- Enter a sell trade if the candlestick breaks below the resistance trend line
- Ensure the breakout is supported by a strong bearish candle formation
- Consider waiting for a close below the line to avoid false signals
Stop Loss
- For sell trades, place a stop loss slightly above the resistance trend line
- For buy trades, place a stop loss below recent swing lows or support levels
- Adjust stops based on market volatility and price structure
Take Profit
- Set take profit near previous support levels or swing lows/highs
- Consider partial exits if the price approaches strong reaction zones
- Let trades run if the trend remains strong and momentum confirms the move
Practical Tips
- Use higher timeframe trend confirmation to filter trades
- Avoid trading when the resistance line is flat or unclear
- Monitor price reaction near the resistance line before entering trades
MT4 Scalping Strategy Using Resistance Trend Line and Waddah Attar Trend Scalper Indicators
This MT4 scalping strategy combines the key resistance levels from the Resistance Trend Line Forex Indicator with the fast trade signals of the Waddah Attar Trend Scalper Indicator.
It is designed for short-term scalping on 1-minute to 5-minute charts.
The Resistance Trend Line indicator draws the most recent resistance on the chart in red, while the Waddah Attar Trend Scalper indicates bullish signals with green histogram bars and bearish signals with red bars.
Take profit targets are set between 4 and 10 pips for quick, precise scalping trades.
Buy Entry Rules
- Wait for the price to approach or bounce off a level below the red resistance trend line.
- Confirm the buy with a green histogram bar on the Waddah Attar Trend Scalper indicator.
- Enter a buy trade at the market price once both conditions are met.
- Set a stop loss just below the recent swing low.
- Set a take profit between 4 and 10 pips or near the next minor resistance level.
Sell Entry Rules
- Wait for the price to reach or test the red resistance trend line.
- Confirm the sell with a red histogram bar on the Waddah Attar Trend Scalper indicator.
- Enter a sell trade at the market price once both conditions are met.
- Set a stop loss just above the resistance line or the recent swing high.
- Set a take profit between 4 and 10 pips or near the next minor support level.
Advantages
- Combines resistance levels with trend signals for higher probability scalping trades.
- Effective on very short timeframes for multiple trades per session.
- Suitable for various currency pairs, including EUR/USD, USD/JPY, EUR/GBP, and AUD/USD.
Drawbacks
- Signals can be less reliable during periods of low market liquidity or outside major trading sessions.
- Small pip targets make profits sensitive to spreads and slippage, especially on lower-volume pairs.
- Frequent scalping trades can be mentally demanding and require sustained focus.
Case Study 1: USD/JPY on 1-Minute Chart
On the USD/JPY 1-minute chart, the price approached just below the red resistance line.
A green histogram appeared on the Waddah Attar Trend Scalper, signaling a buy entry.
The trade was entered at 109.50, with a stop loss at 109.45 and a take profit of 6 pips.
The trade closed successfully within 4 minutes.
Case Study 2: EUR/GBP on 5-Minute Chart
On the EUR/GBP 5-minute chart, the price tested the red resistance trend line.
A red histogram appeared on the Waddah Attar Trend Scalper, confirming a sell entry.
The trade was entered at 0.8500, with a stop loss at 0.8505 and a take profit of 8 pips.
The trade reached the take profit target within 7 minutes.
Strategy Tips
- Focus on high-liquidity pairs during active market sessions for smoother price action.
- Combine the strategy with short-term support and resistance levels to improve entry and exit precision.
- Adjust trade size to manage risk, since small pip targets can be sensitive to volatility.
- Consider using a trailing stop for longer scalps to capture additional pips if momentum continues.
- Keep an economic calendar handy to avoid trading immediately before major news releases.
- Practice patience and wait for clear confirmation from both indicators before entering a trade.
Download Now
Download the “LineFrakUp.mq4” indicator for Metatrader 4
FAQ
How is the resistance trend line calculated?
The indicator analyzes recent price action to determine the most relevant resistance level, which is then plotted as a red trend line on the chart.
Can the indicator be used for breakout trades?
Yes. A breakout above the resistance trend line can indicate a potential buy opportunity, especially when combined with other confirmation tools.
Does the line repaint?
The resistance trend line updates as new price action forms but does not randomly repaint past levels, providing a stable reference for trading decisions.
Summary
The Resistance Trend Line Forex Indicator for MT4 provides a clear visual representation of recent resistance levels.
Traders can use it to plan stop loss placement, identify breakout opportunities, and make confident trading decisions.
The red trend line works across all MT4 symbols and timeframes, making it suitable for scalping, day trading, and short-term strategies.
When combined with trend and momentum indicators, it enhances trade accuracy and overall decision-making.


